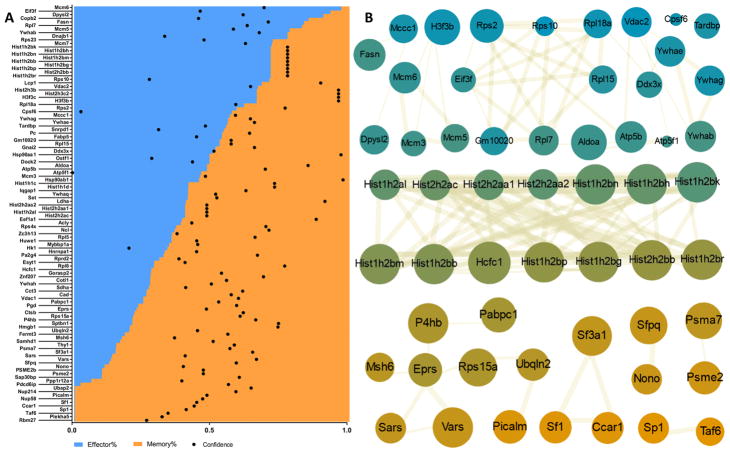
Figure 4.
Contributions from memory/effector groups and network analysis of high-confidence identified proteins. (A) Plot of high-confidence identified proteins sorted by normalized signal contribution from highest effector-like sample percentage to highest memory-like contribution. Overlaid dots reflect normalized confidence of identification as defined by x axis. (B) STRING network analysis. Color of nodes defined by their percentage of memory (orange)/effector (blue) detection. Node size is proportional to the abundance, and connector thickness reflects strength of the known interaction. Main networks identified for primarily memory, effector, or both groups.

