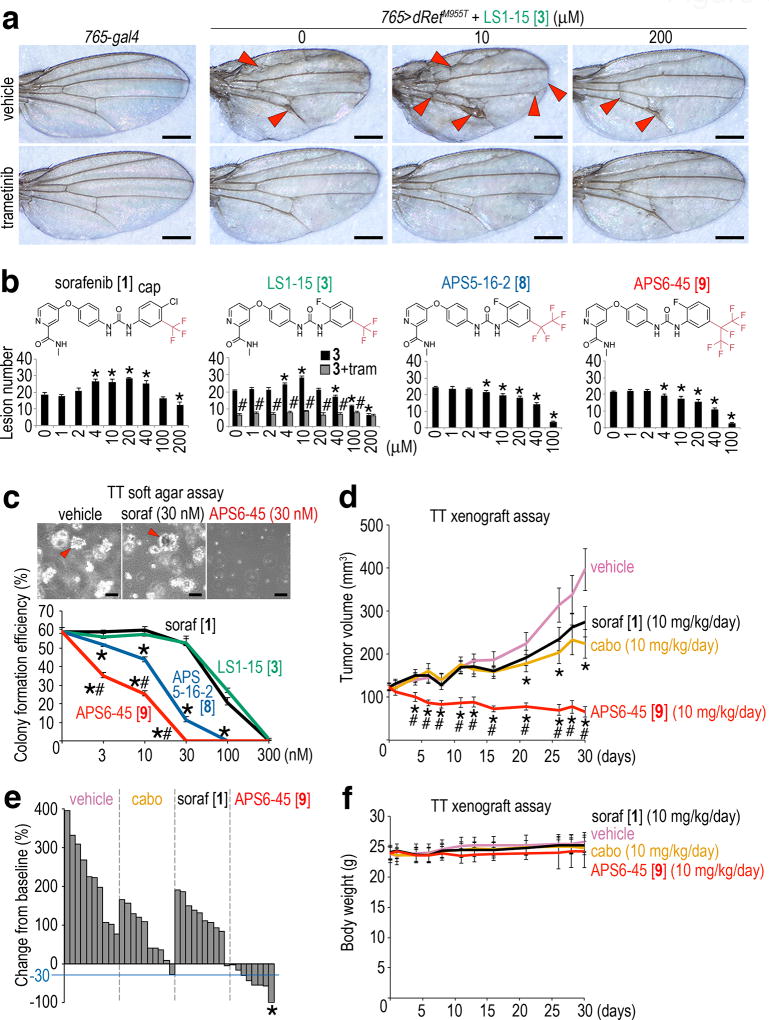
Fig. 6. The novel TCI APS6-45 displays exceptional in vivo efficacy.
a, 765>dRetM955T adults exhibited ectopic vein material (arrowheads). Low-dose 4 enhanced ectopic venation and also notching of the wing margin (arrowheads); high dose suppressed both. 3 (1 µM) strongly suppressed ectopic venation. Scale bars, 500 µm.
b, Quantification of wing venation assays. 1 and 4 showed bipartite effects. tram, 3 (1 µM). Asterisks, p < 0.05 as compared with vehicle control. Pound signs, p < 0.05 as compared with 4 mono-treatment. Error bars, standard errors in triplicate.
c, TT cell colony formation in a soft agar assay was suppressed by 9 and 10. Arrowheads, growing colonies. Scale bars, 100 µm. Error bars, standard errors in triplicate. Asterisks, p < 0.05 in Student’s t-test as compared with 1. Pound signs, p < 0.05 in Student’s t-test as compared with 9.
d–f, Oral administration of 10, mouse TT cell xenografts.
d, In mouse xenografts, in vivo TT growth was more strongly suppressed by 10 than 1 (parent compound) or cabozantinib (MTC standard of care). Error bars, standard errors in 10 mice. Asterisks indicate p < 0.05 in Student’s t-test as compared with vehicle control; pound signs indicate p < 0.05 in Student’s t-test as compared with sorafenib and cabozantinib (cabo). Data from single experiment. e, Waterfall plot showing percent changes in tumor volume on day 30 relative to pretreatment baselines; each bar represents a single animal. The blue line indicates 30% tumor size reduction from baseline, a RECIST criteria49. Asterisk, complete response. Two mice were lost during the course of the experiment due to unknown causes.
f, Administration of 10 had no effect on mouse body weight. Same legend as d.

