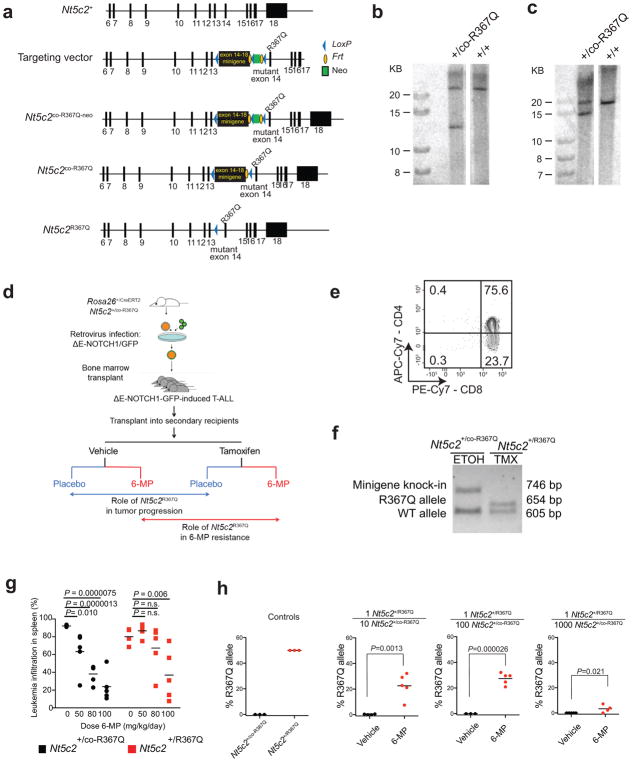
Extended Data Figure 2. Conditional knock-in targeting of Nt5c2, generation and analysis of a Nt5c2R367Q conditional inducible T-ALL model.
a, Schematic representation of the targeting strategy for generation of Nt5c2+/co-R367Q conditional knock-in mice. b, Southern blot analysis of Nt5c2+/+ and targeted Nt5c2+/co-R367Q embryonic stem cells in DNA digestions with BamHI restriction enzyme hybridized with a DNA probe external to the long arm. c, Southern blot analysis of Nt5c2+/+ and targeted Nt5c2+/co-R367Q embryonic stem cells in DNA digestions with ApaI restriction enzyme hybridized with a DNA probe in the short arm. d, Schematic depiction of the strategy for developing conditional inducible Nt5c2+/co-R367Q primary murine T-ALL tumors and for assessing the role of Nt5c2+/R367Q on leukemia progression and response to chemotherapy. e, Representative FACS plot of a Rosa26+/CreERT2 Nt5c2+/co-R367Q ΔE-NOTCH1-induced primary T-ALL tumor with a CD4+, CD8+ immunophenotype. f, Representative genotyping PCR results from genomic DNA of a Rosa26+/CreERT2 Nt5c2+/co-R367Q ΔE-NOTCH1-induced primary T-ALL tumor treated with 4-hydroxytamoxifen (TMX) or vehicle only (ethanol, ETOH) in vitro showing Cre-mediated deletion of the exon 14–18 Nt5c2 wild type mini-gene. g, Tumor burden assessed in the spleen (% GFP+ cells) in mice allografted with NOTCH1-induced Nt5c2+/co-R367Q and isogenic Nt5c2+/R367Q primary leukemia cells treated with a range of 6-MP doses (n = 5 per group). h, Analysis of Nt5c2R367Q allele assessed by qPCR in mice allografted with Nt5c2+/co-R367Q and Nt5c2+/R367Q primary mouse T-ALL cells at a 1:10, 1:100 and 1:1000 Nt5c2+/R367Q:Nt5c2+/co-R367Q dilution treated with vehicle or 6-MP (n = 5 mice per group and n=3 technical replicates for the controls). The horizontal bar represents mean values. P values were calculated using two-tailed Student’s t-test in g and a one-tailed Student’s t-test in h. Data in e and f show representative results from >2 experiments.

