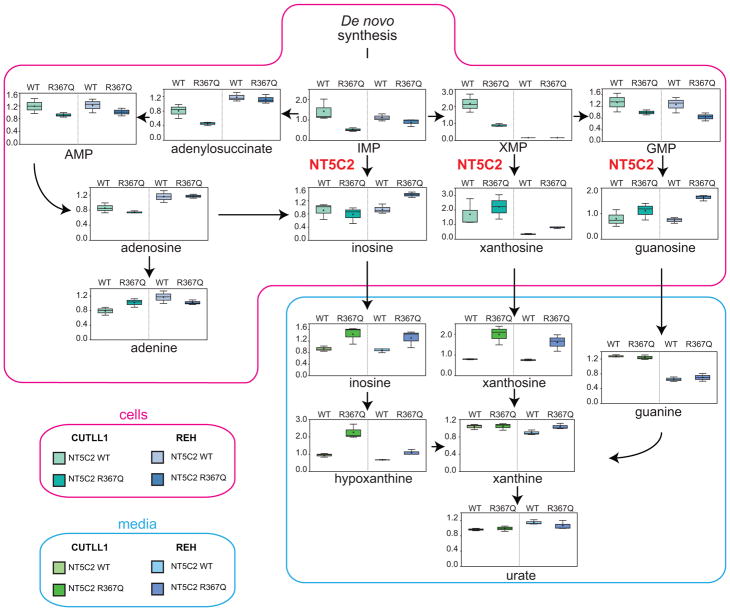
Extended Data Figure 4. NT5C2 R367Q expression displays fitness loss in T-ALL and B-ALL cell lines.
Diagram of the purine de novo biosynthesis and salvage pathways, showing GC/MS and LC/MS/MS metabolic profiles (mass spectrometry scaled intensity, arbitrary units) of CUTLL1 and REH cell lines expressing wild type (WT) NT5C2 or NT5C2 p.R367Q and their corresponding conditioned media (n=3 biological replicates per sample). Box plots represent the upper quartile to lower quartile distribution. + Sign indicates mean value and horizontal line the median value. Whiskers indicate the maximum and minimum values of the distribution.

