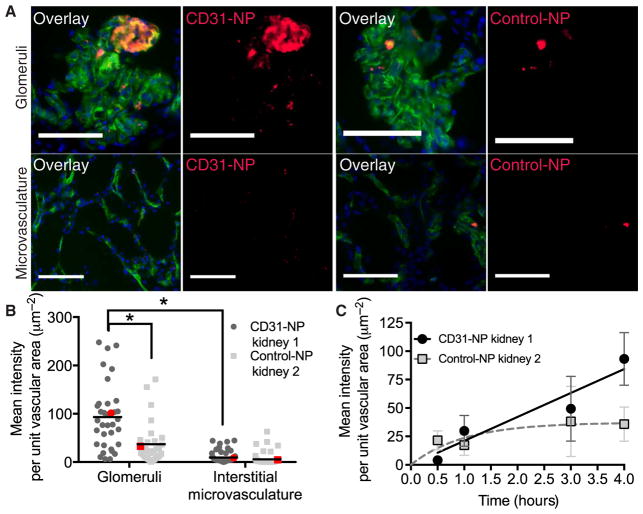
Fig. 3. CD31 targeting enhances NP accumulation in perfused human kidney.
(A) Representative 20× fluorescent images of glomeruli (top) and interstitial microvessels (bottom) for kidneys perfused with either CD31-NPs (left) or Control-NPs (right). Overlay images show vascular stain (Ulex; green), DAPI nuclear stain (blue), and NP accumulation (red). Scale bars, 100 μm. Images are cropped to provide finer details. (B) Quantification of individual image MFI after background subtraction. Each image was normalized to the area of Ulex vascular stain, and every dot represents an individual normalized image mean intensity. The red dots correspond to the images shown in (A). *P < 0.0001 using a Mann-Whitney t test. For the single CD31-NP–treated kidney, n = 35 for images of glomeruli and n = 59 for images of microvasculature; for the single Control-NP–treated kidney, n = 31 for images of glomeruli and n = 56 for images of microvasculature. (C) Time-dependent normalized mean intensity values for CD31-NP versus Control-NP in glomeruli with corresponding fits to a linear equation (CD31-NP, black line) or saturating kinetic equation (Control-NP, dashed gray line). Error bars refer to 95% confidence window of the mean. n for each condition is provided in Table 3.

