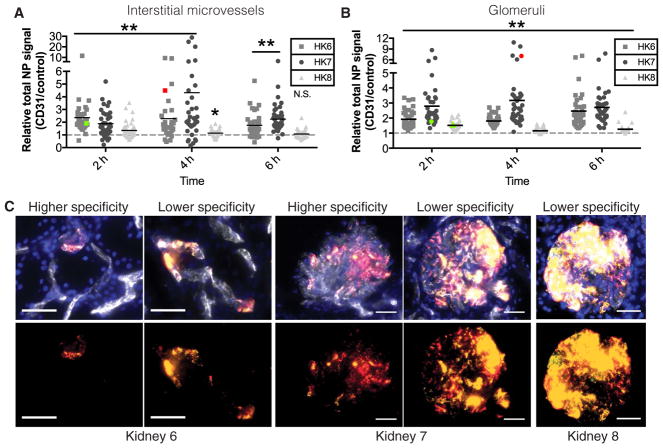
Fig. 6. Effects of CD31-NP targeting in perfused human kidneys.
Quantification of relative NP signal (CD31-NPs/Control-NPs) at 4 hours (h) for kidneys 6 to 8. Each point represents an individual image of either interstitial microvessels (A) or glomeruli (B); nonspecific (1:1) accumulation is represented by dashed gray line. **P < 0.0001 and *P = 0.0024 according to a Wilcoxon signed-rank test. Colored data points correspond to the quantification of the higher (red) or lower (green) specificity images shown in (C). (C) Representative images of either higher or lower specificity regions of NP accumulation in interstitial microvessels of kidney 6 (left) or glomeruli of kidney 7 (middle) and lower specificity regions in glomeruli of kidney 8 (right; DAPI, blue; CD31-NPs, red; Control-NPs, green; NP overlay, yellow; Ulex, white). Scale bars, 50 μm. n for each condition is provided in Table 3.

