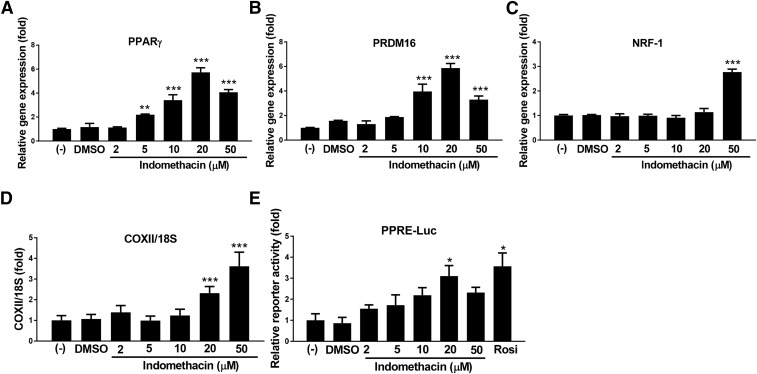
Fig. 2.
Indomethacin dose dependently increased brown adipocyte related markers. (A–C) Gene expression of brown fat selected markers; negative control cells were set at fold 1. (D) Gene expression of mitochondrially encoded cytochrome c oxidase II. (E) Luciferase activity of PPAR reporter. Data = mean ± S.E.M. (n = 3). ***P < 0.001; **P < 0.01;*P < 0.05 compared with the dimethylsulfoxide (DMSO) group.

