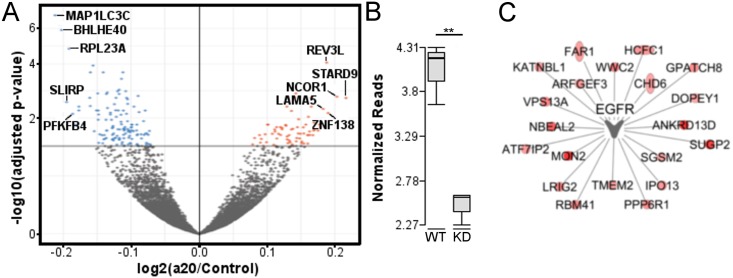
Fig 2. Gene expression changes after wnt3a stimulation in the presence or absence of A20.
A) Volcano plot showing the differentially downregulated (blue) and upregulated (red) genes in A20 knockdown versus control knockdown RKO after 24 hours of treatment with wnt3a. The top five upregulated and downregulated genes are labelled. B) RNA expression of A20 in control (WT) or A20 siRNA knockdown (KD) C) Pathway analysis showing dysregulation of genes related to EGFR signaling in RKO cells stimulated with wnt3a after A20 siRNA knockdown.

