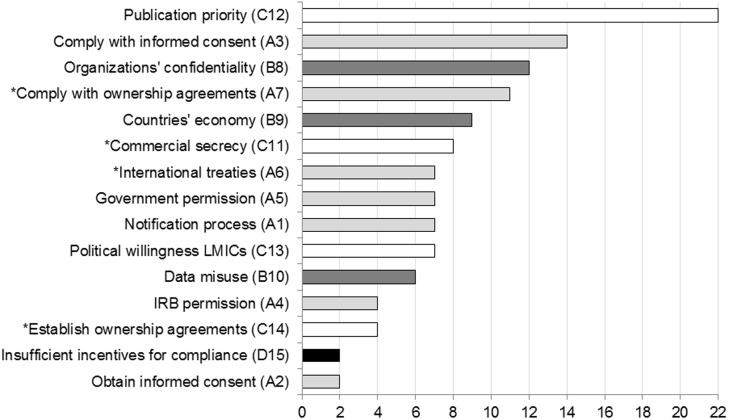
Fig 9. Publication priority was the most frequently mentioned barrier.
Barriers are ranked according to their frequency of occurrence in absolute numbers (n KOLs) and in decreasing order. Color codes and numbering correspond to the main barriers and underlying causes in the root-cause analysis trees, in Figs 3–6: compliance to regulations (A#x light grey), negative consequences (B#x dark grey), self-interest (C#x white), and insufficient incentives for compliance (D#x black). The asterisk identifies barriers that persist in the downstream phases of the innovation cycle (Fig 7).

