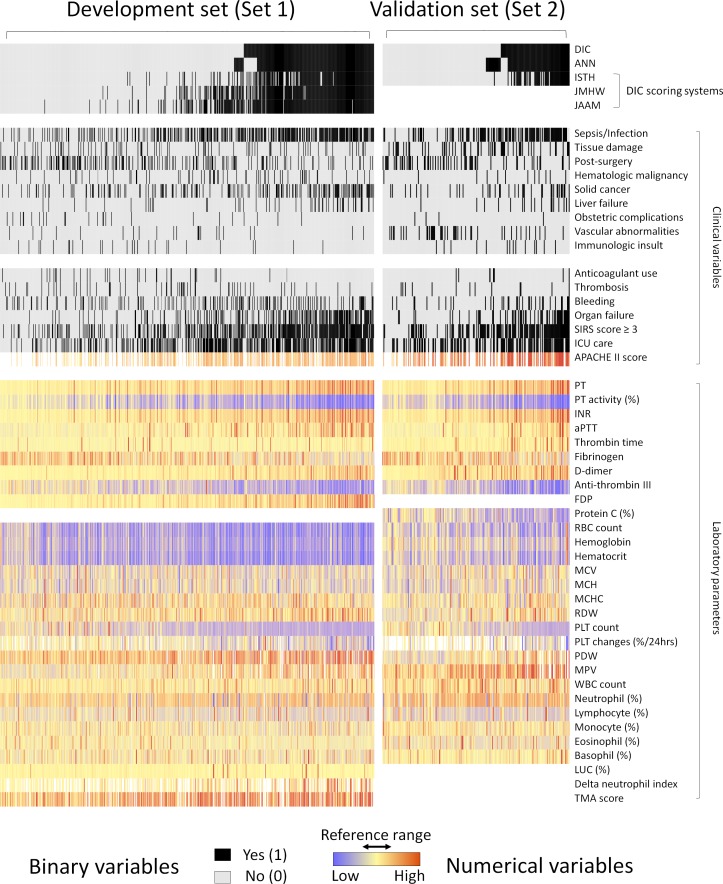
Fig 2. Heat map presentation of the datasets used in this study.
The x-axis denotes individual cases and the y-axis corresponds to the clinical variables. Each cell shows values of variables for each case. All cases are sorted horizontally by the labeled DIC status and predicted ANN model values. Rows 2–5 (ANN model, ISTH, JMHW, and JAAM criteria) show predictions of different DIC diagnostic classifiers based on the cut-off values (0.501 for ANN) or points (Table 1).

