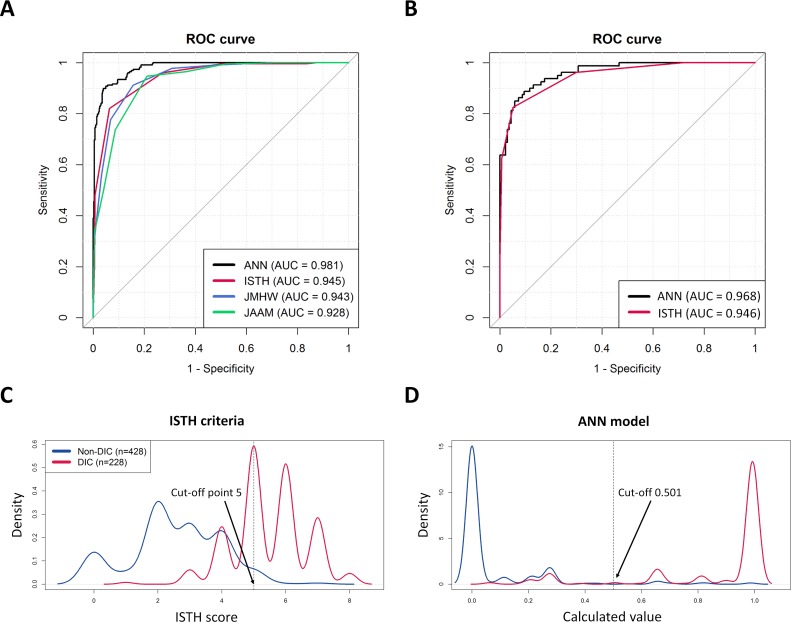
Fig 4. Diagnostic performance of ANN model and scoring systems with receiver operating characteristic curve analysis and density plot.
(A) Training (Set 1): ANN model shows the best performance among the four diagnostic classifiers. The area under curve (AUC) values: ANN (0.981), ISTH (0.945), JMHW (0.943), and JAAM (0.928). (B) External validation (Set 2): four variables were unavailable owing to the different hematologic analyzers, therefore the AUC value was compromised compared to the development set in the ANN model; ANN (0.968), ISTH (0.946). (C, D) Density plots of two represented diagnostic classifiers (ANN model, ISTH criteria) shows that the ANN model far obviously differentiates two groups (DIC and non-DIC). The cut-off value for the ANN model is determined at 0.501.

