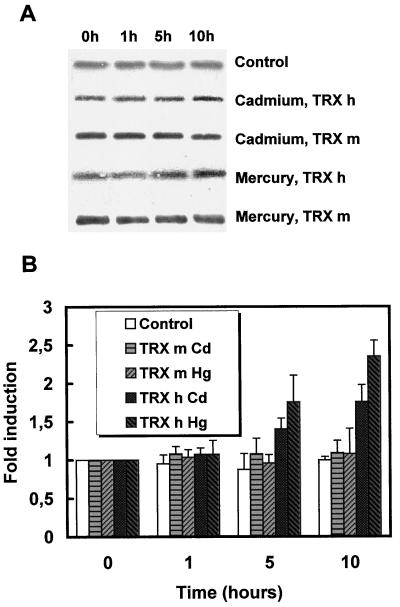
Figure 2.
Analysis of TRX m and TRX h protein levels in response to heavy metals. A, Western analysis of TRX m and TRX h levels in response to heavy metals. Cells were treated with sterile water (Control), 100 μm CdCl2 (Cadmium), or 1 μm HgCl2 (Mercury). Crude extracts prepared after 0, 1, 5, or 10 h after treatment were analyzed by western blot, as described in Methods. The control corresponds to TRX h in untreated cells. B, Quantification of TRX m and TRX h protein levels in response to heavy metals. Western blots from three independent experiments (performed as in A) were used to quantify the accumulation of TRX m and TRX h after heavy-metal treatment. Quantification was performed by densitometric scans. The average induction factors are presented and the error bars represent sd.

