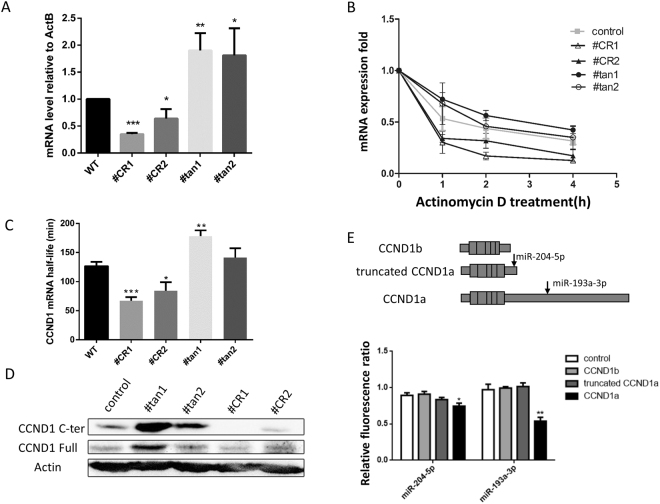
Figure 5.
Effects of APA on mRNA expression level and stability. (A) CCND1 mRNA expression levels were measured by qRT-PCR. Student’s t-test: *P < 0.05, **P < 0.01, ***P < 0.001. (B) The mRNA decay rate was measured by qRT-PCR. The relative expression levels of CCND1 transcripts at the APA-1 site in mutated and wild type cells were analyzed at 0 h, 1 h, 2 h and 4 h after inhibition of transcription with 10 µg/mL actinomycin D. Data at each time point are representative of three independent experiments and are normalized to ACTB expression. (C) mRNA half-life. Student’s t-test: *P < 0.1, **P < 0.05, ***P < 0.01. (D) Western blot detection of CCND1 protein. The gels were run under the same experimental conditions. Cropped gels/blots are presented. (Full-length gels/blots are shown in Supplementary Fig. 3 with indicated cropping lines). (E) Repression of different CCND1 3′UTR isoforms by miRNAs. Upper panel: Schematic representation of predicted miRNA binding sites. Lower panel: Repression of CCND1 mRNA isoforms with miRNA, as measured with dual luciferase assay. 293T cells were co-transfected with miRNAs and psiCheck-2 plasmids carrying different CCND1 3′UTRs, and the ratio of Renilla and Firefly luciferase activities was determined. The data were normalized to measurements of cells co-transfected with empty psiCheck 2 negative control miRNA. Student’s t-test: *P < 0.1, **P < 0.05, ***P < 0.01.

