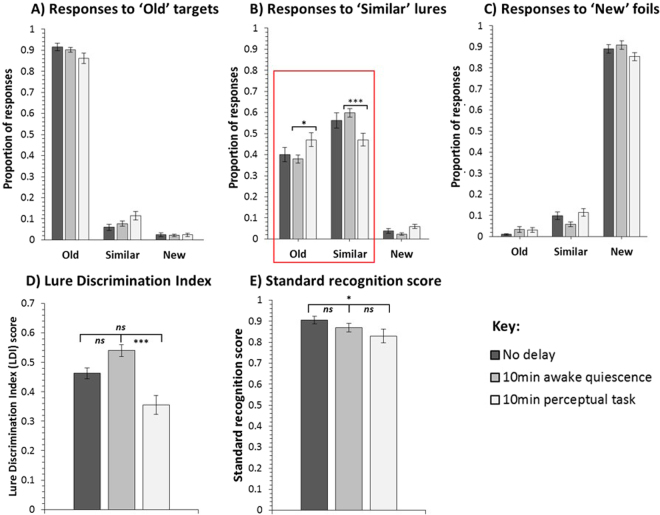
Figure 2.
Mnemonic Similarity Test (MST) response data for the no delay (N = 19), 10 min awake quiescence delay (N = 19), and 10 min perceptual task delay (N = 18) groups showing the proportion of old, similar, and new, responses to (A) ‘old’ targets, (B) ‘similar’ lures, and (C) ‘new’ foils. Lure Discrimination Index (LDI) scores for the three groups are also shown (D) – this measure is calculated as the proportion of “similar” responses to lures minus the proportion of “similar” responses to foils, and thus reflects a person’s ability to discriminate similar lures from old targets, while controlling for any response biases. Standard recognition measure (E) - this measure is calculated as the proportion of “old” responses to target items minus the proportion of “old” responses to foils, and thus reflects a person’s ability to correctly endorse old targets, while rejecting new foils. The awake quiescence delay group’s ability to discriminate between targets and lures was significantly better than that of the perceptual task delay group, as shown in the groups’ (D) LDI scores and (B) specific responses to lures. The latter (see red box) shows that the perceptual task delay group provided a significantly higher proportion of (incorrect) old responses to lure items than those in the awake quiescence delay group. In contrast, the awake quiescence delay group provided a significantly higher proportion of (correct) similar responses to lure items than those in the perceptual task delay. In all cases, error bars show the standard error of the mean. Non-corrected significance levels: *p < 0.05, **p < 0.01, ***p < 0.001.

