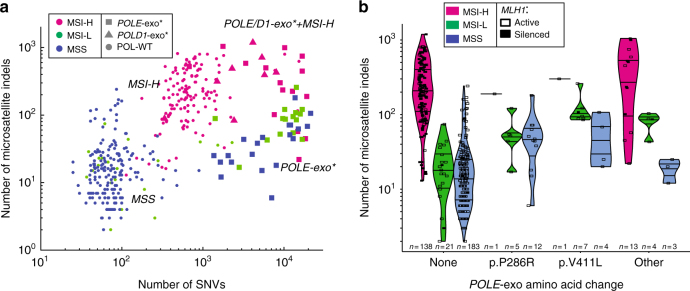
Fig. 1.
The landscape of single-nucleotide variants (SNVs) and microsatellite indels in endometrial cancer. a Number of SNVs and microsatellite indels for tumors in the TCGA endometrial cohort (UCEC). Colors represent the TCGA microsatellite classification determined using the Bethesda protocol,11 and shapes represent the mutation status of POLE and POLD1 exonuclease domains. All samples with available Bethesda classification and MS indel calls are shown (n = 401). b Number of microsatellite indels for endometrial tumors with different POLE-exo* mutations. Color represents MSI status, and tumors with MLH1 epigenetic silencing are displayed as filled boxes. P286R and V411L are the two most common POLE exonuclease domain mutations in the cohort. All samples with Bethesda classification, MS indel calls, and MLH1 silencing calls available are shown (n = 392)

