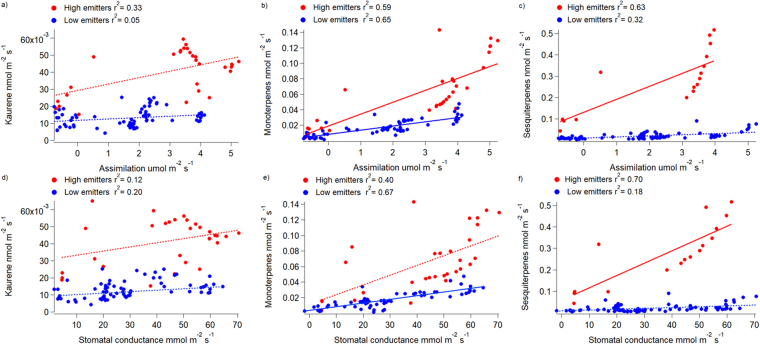
Figure 3.
Linear correlations of CO2 assimilation rate (upper part) and stomatal conductance (bottom part) with kaurene (a,d), monoterpenes (b,e) and sesquiterpenes (c,f) emission rates for the diurnal cycles measurements of seven individuals of H. halimifolium. Red dots represent the high emitter group and blue dots the low emitter group. Thick lines represent a correlation and dashed lines represent a lack of correlation. Note that for sesquiterpenes only one plant represents the high emitter group. R2 are shown in the legend, all correlations were statistically significant (p < 0.001) except for the relationship between kaurene emission rates and CO2 assimilation rates.

