Fig. 5.
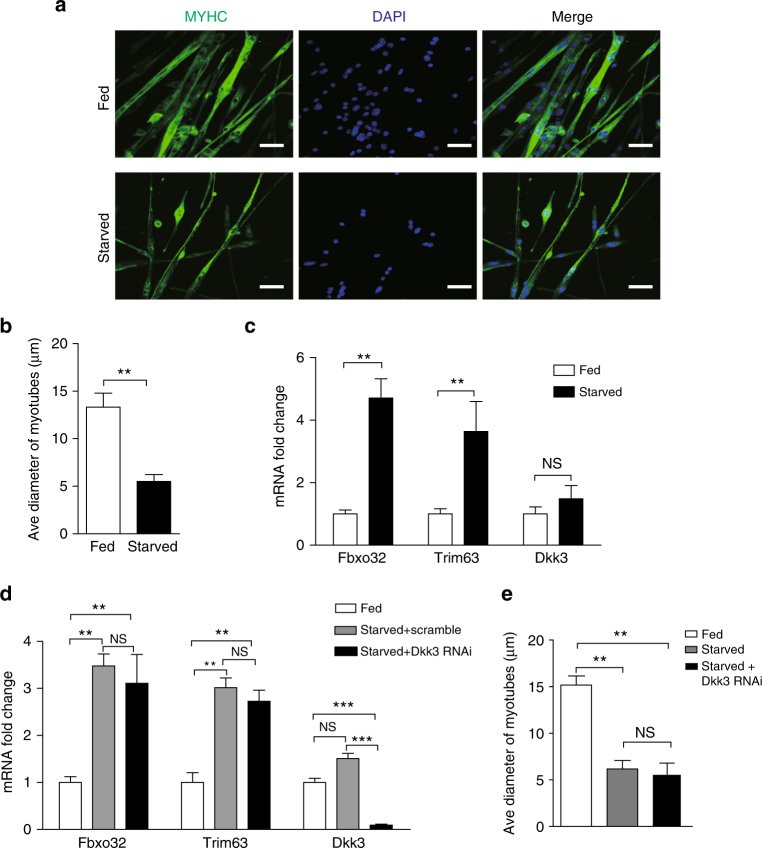
Starvation-induced muscle atrophy did not depend on Dkk3. a Representative images of atrophy induced by starvation in myotubes. Green indicated MYHC staining; blue indicated DAPI staining of nuclei; Merge indicated merged images of MYHC and DAPI. Scale bars, 50 μm. b Average diameters of myotubes with or without serum starvation. Error bars indicated s.d. and were based on three independent experiments. ** indicated p < 0.01. c Expression levels of Fbxo32, Trim63, and Dkk3 in fed or starved myotubes. Error bars indicated s.d. and were based on three independent experiments. ** indicated p < 0.01. NS indicated no significant changes. d Dkk3 RNAi showed no effects on Fbxo32 and Trim63 expression level in starved myotubes. Primary myotubes were first serum starved in Hank’s buffer. Adenovirus-encoding shRNA against Dkk3 or scramble control was next applied to the starved myotubes. Forty-eight hours after virus infection, the myotubes were harvested and subjected for RT-qPCR analysis of the mRNA levels of Fbxo32, Trim63,and Dkk3. Error bars indicated s.d. and were based on three independent experiments. ** indicated p < 0.01. NS indicated no significant changes. e Average diameters of myotubes with or without serum starvation, and Dkk3 RNAi after serum starvation. Error bars indicated by s.d. and were based on three independent experiments. ** indicated p < 0.01. NS indicated no significant changes. All p-values were based on two-tailed t-test

