Fig. 2.
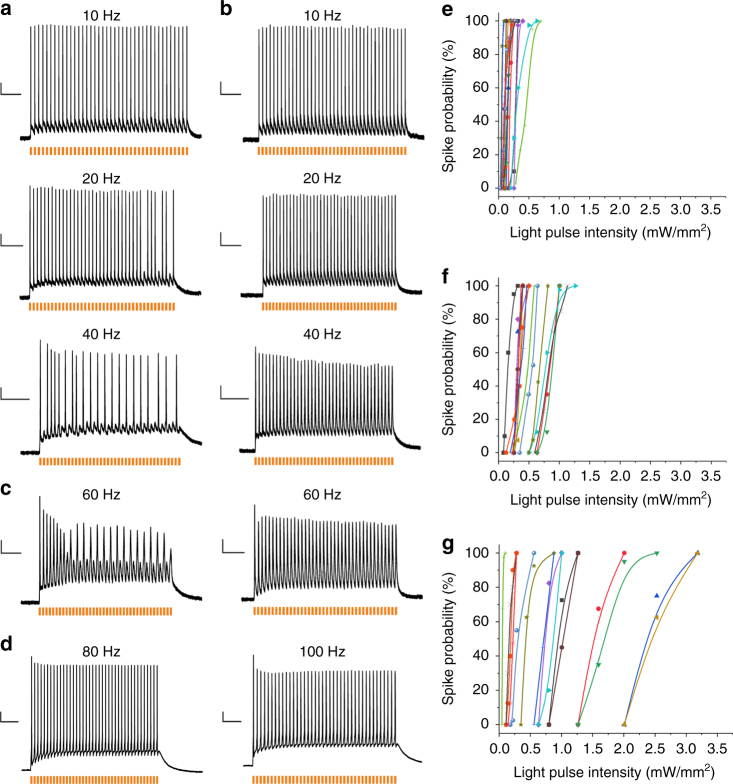
Light-induced spiking in rat hippocampal neurons. a–d Spiking traces at different light-pulse frequencies. Rat hippocampal neurons heterologously expressing Chrimson-EYFP (a), Chrimson-EYFP K176R/Y261F/S267M (vf-Chrimson-EYFP) (b) and Chrimson-EYFP Y261F/S267M (f-Chrimson-EYFP) (c, d) were investigated by whole cell patch-clamp experiments under current-clamp conditions (λ = 594 nm, pulse width = 3 ms, saturating intensity of 11–30 mW/mm2). c Traces from two different cells at a stimulation frequency of 60 Hz. d Traces from one cell at stimulation frequencies of 80 Hz and 100 Hz. e–g The dependence of spike probability on light pulse intensity for Chrimson-EYFP (e) (15 different cells), Chrimson-EYFP Y261F/S267M (f-Chrimson-EYFP) (f) (15 different cells) and Chrimson-EYFP K176R/Y261F/S267M (vf-Chrimson-EYFP) (g) (15 different cells). The action potentials were triggered by 40 pulses (λ = 594 nm, pulse width = 3 ms, ν = 10 Hz) of indicated light intensities. In order to determine the spike probability, the number of light-triggered spikes was divided by the total number of light pulses. Scale bars: y-axis: 10 mV, time-axis: (a, b, 10 Hz) 500 ms (a, b, 20 Hz) 300 ms (a, b, 40 Hz) 200 ms (c, 60 Hz) 100 ms (d, 80 Hz) 70 ms (d, 100 Hz) 50 ms

