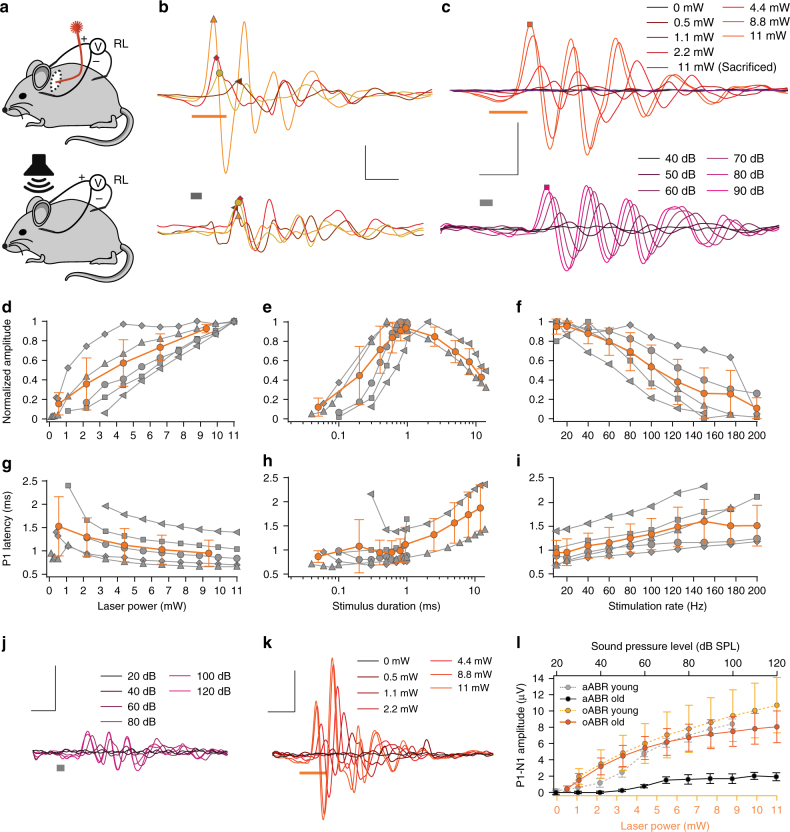
Fig. 5.
Single-channel oCIs drive oABRs in hearing and deaf mice. a Experimental set-up for oABR-recordings in mice: a 50 µm optical fiber coupled to a 594 nm Obis laser was implanted into scala tympani via a posterior tympanotomy and the round window. Recordings of far-field optically evoked potentials were performed by intradermal needle electrodes. For aABR recordings a free-field speaker was employed (lower panel). b Comparing oABRs (upper panel) and aABRs (lower panel) at strong stimulation levels for four mice (average of 1000 trials). oABRs were recorded in response to 1 ms long, 11 mW, 594 nm laser pulse at 10 Hz, aABRs of the same mice in response to 80 dB (SPL peak equivalent) clicks. Bars indicate the stimulus timing. c oABRs (upper panel, 594 nm, 1 ms at 10 s-1) and aABRs (lower panel, clicks at 10 s-1, values in SPL [peak equivalent]) recorded from an exemplary AAV-injected mouse at increasing stimulus intensities. d–f Normalized P1-N1-amplitude as a function of laser intensity (d 1 ms at 20 Hz), pulse duration (e 11 mW at 20 Hz), and stimulus rate (f 11 mW, 1 ms). Group average (lines) and s.d. (error bars) are shown in orange (same for g–i). g–i P1-latency as a function of laser intensity (g as in d), duration (h as in e), and rate (i as in f). j Exemplary aABR recordings done as in a–c using a 9 months-old mouse (following postnatal AAV-Chrimson-EYFP injection: elevated acoustic thresholds (around 60 dB [SPL], compare to c). k oABR recordings done as in a–c in the same mouse as in j, using 1 ms long laser pulses: thresholds similar to injected mice at 2–3 months of age (around 1 mW, compare to c). l P1-N1-amplitude of oABR (orange) and P1-N1-amplitude of aABR (gray) as function of stimulus intensity in young (2–3 months-old) and old (9 months-old) mice (n = 5 for each group, means (lines) ± s.e.m. (error bars) are shown. Symbols in d–i mark results from individual animals. Scale bars (b, c, j, k): 1 ms, 5 µV

