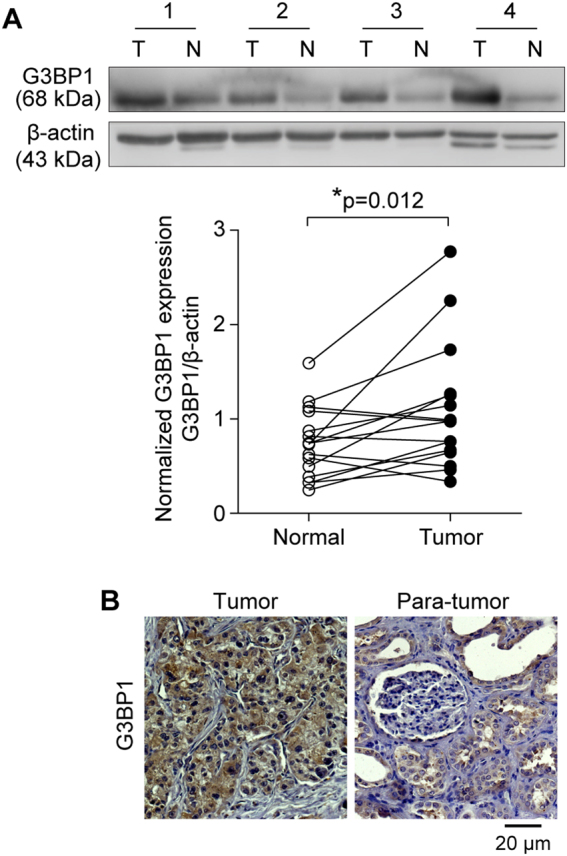
Fig. 1. The expression of G3BP1 is increased in RCC.

a G3BP1 expression in 16 pairs of primary RCC (T) and adjacent normal kidney tissues (N) were examined by Western blot. Upper panel: representative four pairs of Western blot images. Lower panel: the expression of G3BP1 was quantified by normalizing with β-actin, and all 16 pairs of RCC patient samples were analyzed using a paired t-test, p = 0.012. b G3BP1 expression was examined by immunohistochemistry staining in a study cohort with 43 pairs of RCC (tumor) and adjacent normal kidney tissues (para-tumor). Representative G3BP1 staining of RCC and paired non-tumor sections were shown, and brown signal indicated the G3BP1-positive staining.
