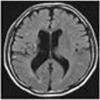
Table 2.
Characteristics of APOSC implantation in each patient
| Characteristics | Patient #1 | Patient #2 | Patient #3 | Patient #4 | Patient #5 | Patient #6 |
|---|---|---|---|---|---|---|
| A. S/S | Rt hemiparesis | Rt hemiparesis | Rt hemiparesis | Lt hemiparesis | Lt hemiparesis | Lt hemiparesis |
| B. MRI-T2WI |

|

|

|

|

|

|
| C. Stroke history (months) | 51 | 11 | 12 | 16 | 20 | 29 |
| D. No. of injected cells | 2 × 10⁶ | 2 × 10⁶ | 2 × 10⁶ | 2 × 10⁶ | 2 × 10⁶ | 2 × 10⁶ |
| E. Purity of p75+ cells | 91.5 % | 90.4 % | 95.5 % | 91.7 % | 91 % | 91% |
| F. No. of IC trajectory | 3 | 3 | 3 | 3 | 3 | 3 |
S/S symptoms and signs, MRI-T2* T2* image in MRI, No. numbers, Lt left limbs, Rt right limbs, y years, IC intracerrbral
