Fig. 1.
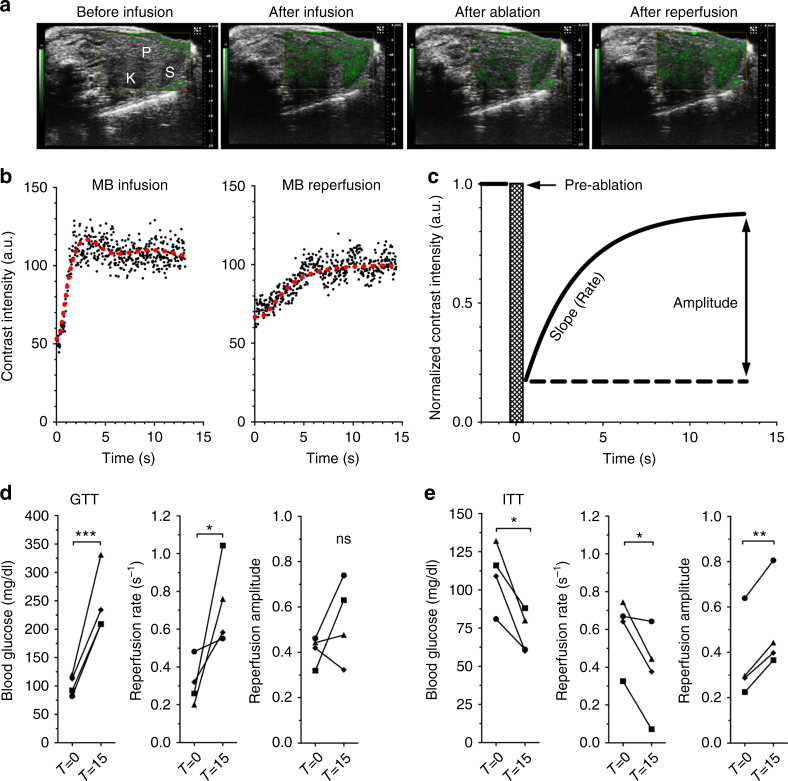
CEUS measurements and glucose-dependent changes in the pancreatic blood-flow dynamics in vivo. a Representative overlay images of NL contrast signal (green) on regular B-mode ultrasound image of pancreas (P), kidney (K), and spleen (S), before and after contrast infusion, and immediately following flash destruction (ablation) and reperfusion. b Representative time course of NL contrast signal infusion (left) and reperfusion following flash destruction (right). Red line indicates moving average of the signal. c Exponential rise fit of reperfusion data normalized to pre-flash destruction (pre-ablation) intensity. d Changes in blood glucose, pancreas reperfusion rate, and pancreas reperfusion amplitude before (T = 0) and 15 min after (T = 15) glucose delivery. e As in d before and 15 min after insulin delivery in C57BL/6 mice. *p < 0.05, **p < 0.01, ***p < 0.001 comparing groups indicated (paired t-test data in d, e). Data in d, e represents n = 4 mice each, with each mouse indicated by a different symbol

