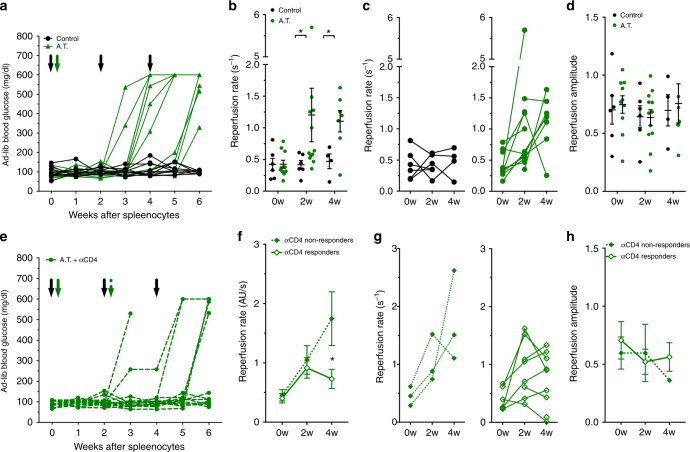
Fig. 5.
CEUS non-invasively detects changes in pancreas blood flow dynamics associated with immunomodulatory halting of disease. a Ad-lib blood-glucose time courses in adoptive transfer animals treated with splenocytes from diabetic female NOD donors (A.T., green) or treated with buffer alone (Control, black). Black arrows indicate time points of CEUS scans, green arrow indicates delivery of splenocytes. b Reperfusion rate in A.T. animals (green) or control animals (black) at baseline (0w), 2 weeks (2w) and 4 weeks (4w) post splenocyte or vehicle transfer. c Data in b showing changes in individual mice for reperfusion rate. d As in b for reperfusion amplitude. e Ad-lib blood-glucose time courses of A.T. animals that were treated with 20 mg anti-CD4 antibody. Black arrows indicate time of CEUS scans, green solid arrow indicates time of splenocyte delivery, green striped arrow indicates time of anti-CD4 treatment. Animals that progressed to hyperglycemia within 6 weeks were denoted as non-responders. f Average reperfusion rate in anti-CD4 responders (open diamonds) and non-responders (closed diamonds) before (0w), 2 and 4 weeks post splenocyte transfer. g Data in f showing changes in individual responder and non-responder mice for reperfusion rate. h As in f for reperfusion amplitude. Error bars represent s.e.m. *p < 0.05, **p < 0.01, ***p < 0.001 comparing groups indicated (paired t-test for data in c, g; unpaired t-test for data in f, h; ANOVA for data in b, d. Data in a–d represents n = 11 AT mice and n = 6 control mice, data in e–h represents n = 9 responder mice and 3 non-responder mice

