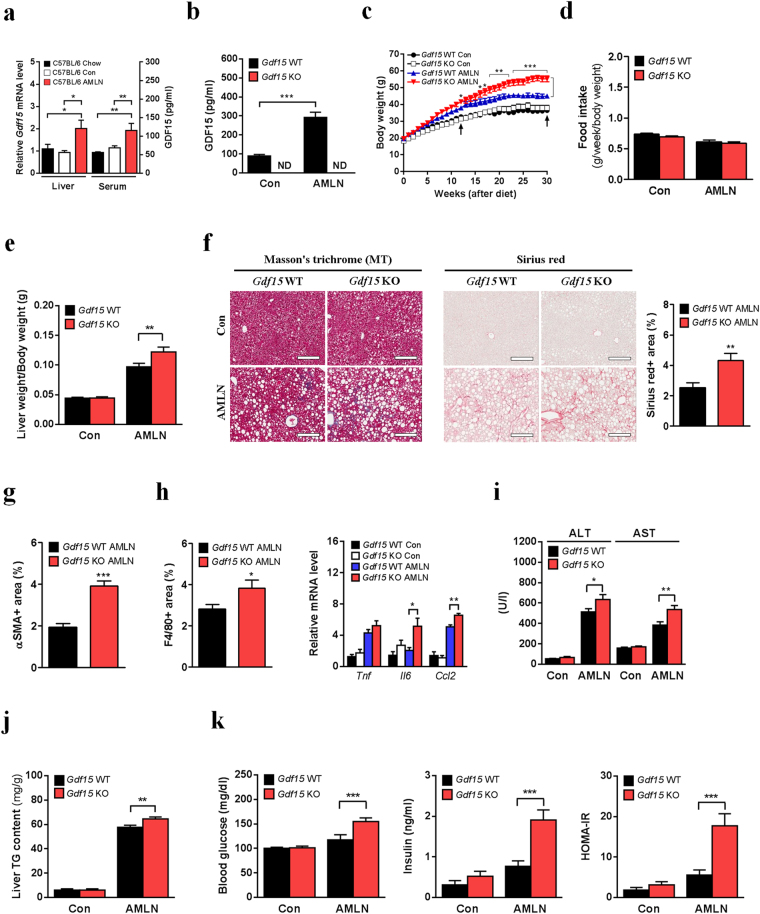
Figure 4.
Gdf15 deletion aggravates NASH and related metabolic parameters in AMLN diet-fed mice. (a) Relative hepatic Gdf15 mRNA (n = 5–7) and serum GDF15 levels (n = 7) in C57BL/6 mice fed standard chow (Chow), matched control (Con) or AMLN diet (AMLN). (b–k) Serum GDF15 level (b, n = 6–10), body weight (c, n = 7–16), food intake adjusted for body weight (d, n = 7–12), liver weight adjusted for body weight (e, n = 7–12), liver MT staining (left panel of f), Sirius red staining and quantification (right panel of f), quantification of αSMA immunochemistry (g), quantification of F4/80 immunochemistry (left panel of h), relative inflammatory gene expression (right panel of h, n = 5–7), serum ALT/AST levels (i, n = 6–9), liver TG content (j, n = 6–9), fasting glucose/insulin levels (left and middle panels of k, n = 4–6) and HOMA-IR index (right panel of k, n = 4–6) in Gdf15–/– and control mice fed AMLN or control diet for 30 weeks. ND indicates not detected. Arrows indicate the time of body weight measurement at 12 weeks and 30 weeks of AMLN diet feeding. Scale bars for MT and Sirius red staining, 200 μm. Data are means ± SEM. *p < 0.05, **p < 0.01, ***p < 0.001.

