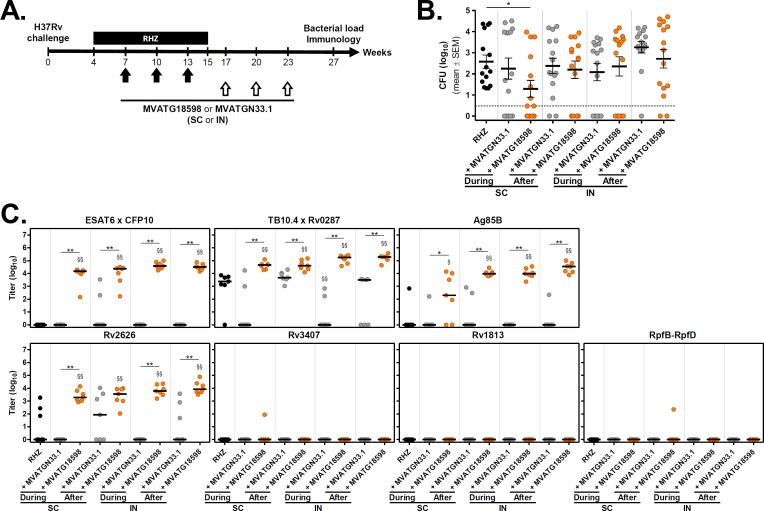
Fig 3. Evaluation of immunization routes and positioning of MVATG18598 in the post-exposure BALB/c mouse model.
(A) Scheme of immunotherapy experiments. BALB/c mice were infected with a low dose aerosol of M. tuberculosis H37Rv. Four weeks later, mice were treated with an antibiotic regimen (RHZ) for 11 weeks. A subset of antibiotic-treated mice was vaccinated, through subcutaneous (SC) or intranasal (IN) routes, three times with a 3-week interval, with either MVATGN33.1 or MVATG18598 during (Weeks 7, 10 and 13) or after (Weeks 17, 20 and 23) chemotherapy. Twelve weeks after the end of the antibiotic regimen (Week 27), the number of viable bacteria in the lungs of animals was determined. (B) M. tuberculosis CFU counts after the completion of the antibiotic regimen in mice vaccinated or not (black) with either MVATGN33.1 (grey) or MVATG18598 (orange). Each symbol represents CFU value of individual mice. Dotted line indicates the lower limit of detection. Results are expressed as mean (black line) log10 CFU ± S.E.M. Statistical analysis was performed using a Mann-Whitney test. *, p<0.05. (C) Titers of antibodies specific to MVATG18598-expressed antigens at the relapse evaluation. Each symbol represents antibody titer (log10) of individual mice vaccinated or not (black) with either MVATGN33.1 (grey) or MVATG18598 (orange). Black line represents median value for each group. Statistical analysis was performed using a Mann-Whitney test. §, p<0.05 and §§, p<0.01 for comparison with RHZ group. *, p<0.05 and **, p<0.01 for comparison between MVATGN33.1- and MVATG18598-vaccinated groups.

