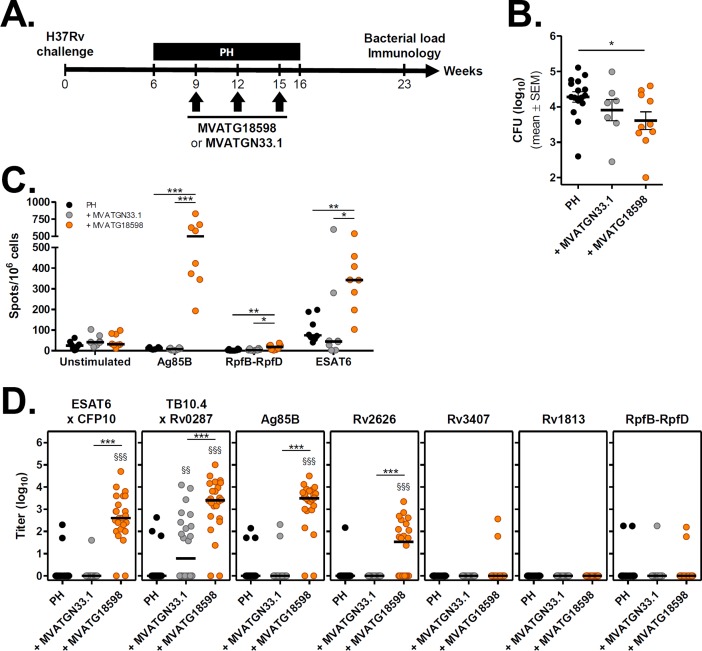
Fig 5. Efficacy of MVATG18598 in the post-exposure C57BL/6 mouse model.
(A) Scheme of immunotherapy experiments. C57BL/6 mice were infected and treated with an antibiotic regimen (P, rifapentine and H, isoniazid) as described in Material and Methods section. Two subsets of antibiotic-treated mice received 3 injections of either MVATGN33.1 or MVATG18598 through SC route during chemotherapy (Weeks 9, 12 and 15). Seven weeks after end of antibiotic regimen (Week 23), number of viable bacteria in the lungs of animals was determined and Ag-specific immune responses were assayed. (B) M. tuberculosis CFU counts in the lungs after the completion of the antibiotic regimen alone (PH, black) or in combination with MVATGN33.1 (grey) or MVATG18598 (orange). Each symbol represents the CFU value of an individual mouse. Results are expressed as mean (black line) log10 CFU ± S.E.M. Statistical analysis was performed using a Mann-Whitney test. *, p<0.05. (C) IFNγ responses following stimulation of splenocytes from MVATGN33.1- or MVATG18598-vaccinated C57BL/6 mice with Mtb antigen-specific peptides. Cells were stimulated or not with pool of peptides specific to the Ag85B (Pool 3), RpfB-RpfD (Pool 3) or ESAT6 for IFNγ ELISpot assay as described in Material and Methods section. Results are shown as the number of IFNγ-producing cells per 106 splenocytes (spots/106 cells) following stimulation or not (Unstimulated) with pools of peptides. Each experimental group is composed of 8 mice resulting from two cumulated runs with 4 mice per run randomly selected at the end of the in vivo experiment part. Each symbol represents an individual mouse and black lines represent median values of each group. Statistical analysis was performed using a Mann-Whitney test: *, p<0.05; **, p<0.01 and ***, p<0.001. (D) Titers of antibodies specific to MVATG18598-expressed antigens at the relapse evaluation. Each symbol represents antibody titer (log10) of individual mice vaccinated or not (black) with either MVATGN33.1 (grey) or MVATG18598 (orange). Black line represents median value for each group. Statistical analysis was performed using a Mann-Whitney test. §§, p<0.01 and §§§, p<0.001 for comparison with RHZ group. ***, p<0.001 for comparison between MVATGN33.1- and MVATG18598-vaccinated groups.

