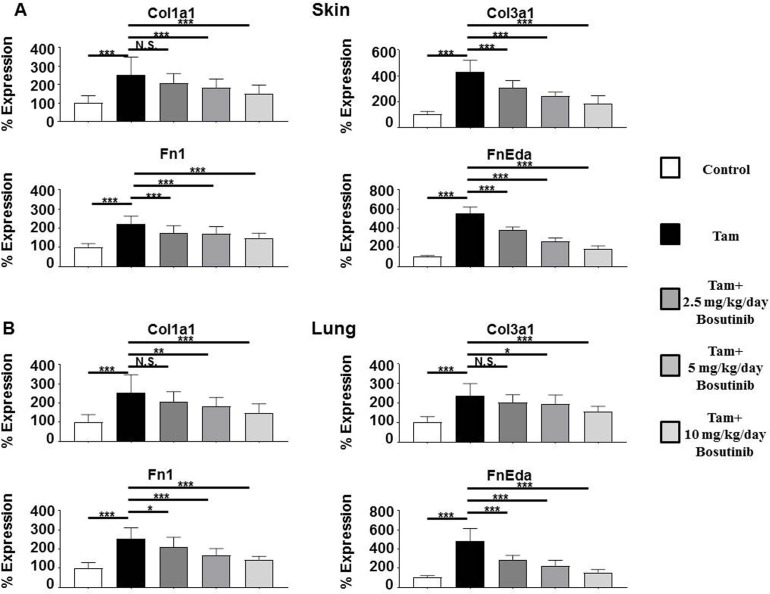
Fig 3. Expression of genes encoding ECM components in the skin and lungs from control, tamoxifen-injected untreated and tamoxifen-injected Bosutinib-treated TBRIca-Col1a2-Cre transgenic mice.
Expression of Col1a1, Col3a1, Fn1, and Fn-Eda in skin (A) and lung (B). The values shown are the mean (+/- SD) fold change levels of gene expression from each treatment group (n = 6) performed in triplicate for each tissue. Expression levels were normalized to 18S levels and the expression levels in untreated controls. Values for other samples are expressed relative to the normalized control. Significance was determined by Student’s T-test. Statistical significance: *: p<0.05, **: p<0.01, ***: p<0.001.

