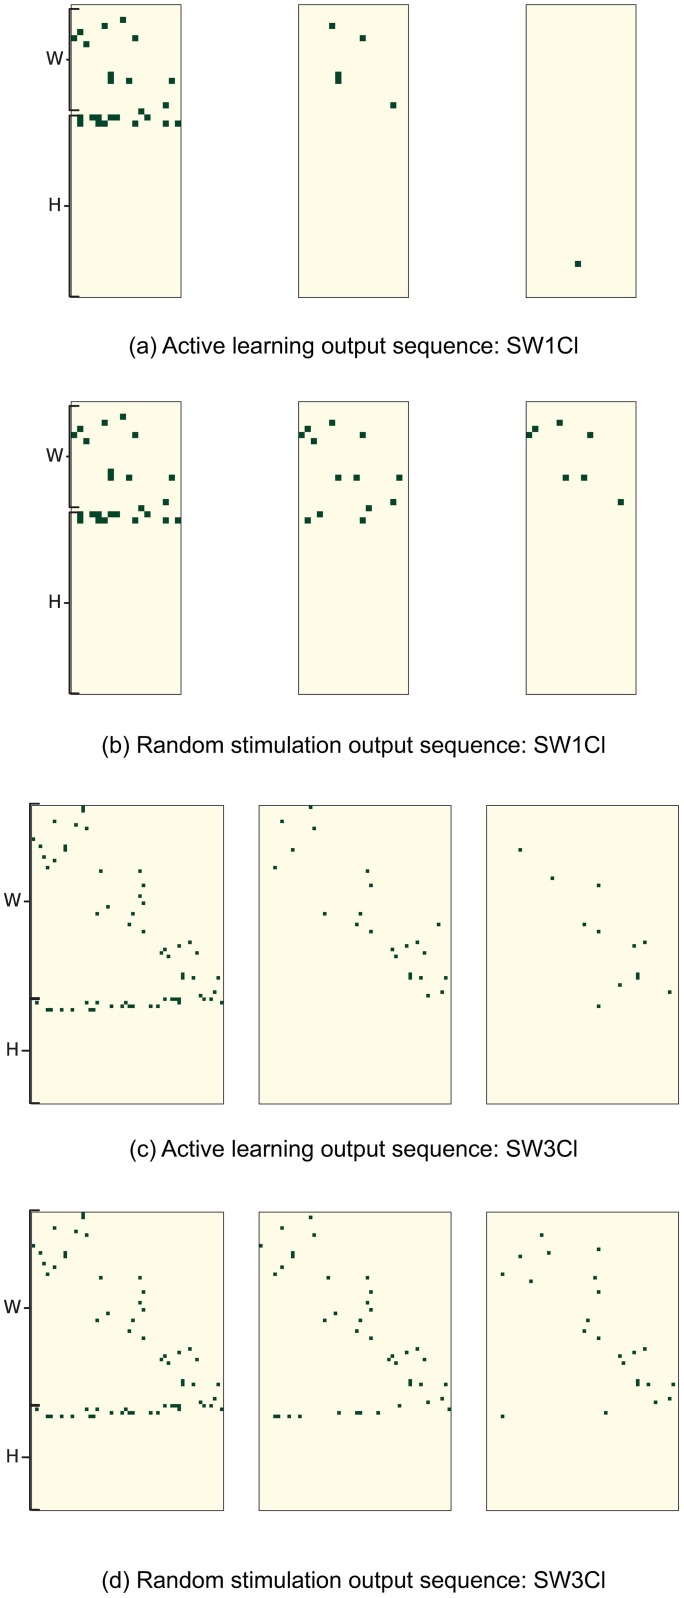
Fig 8. Comparison of the edge discovering process for networks SW1CL and SW3CL using active learning versus random stimulation.
Rows show misclassified edges in the adjacency matrices W and H as a function of samples. Rows 1 and 3 show misclassified edges as a function of time when the active learning stimulation policy is used, while rows 2 and 4 show the same network probed with a random stimulation policy. The misclassified edge matrix under active learning quickly becomes sparse as the number of misclassifications goes to zero, random stimulation produces the same results but in a longer time frame.

