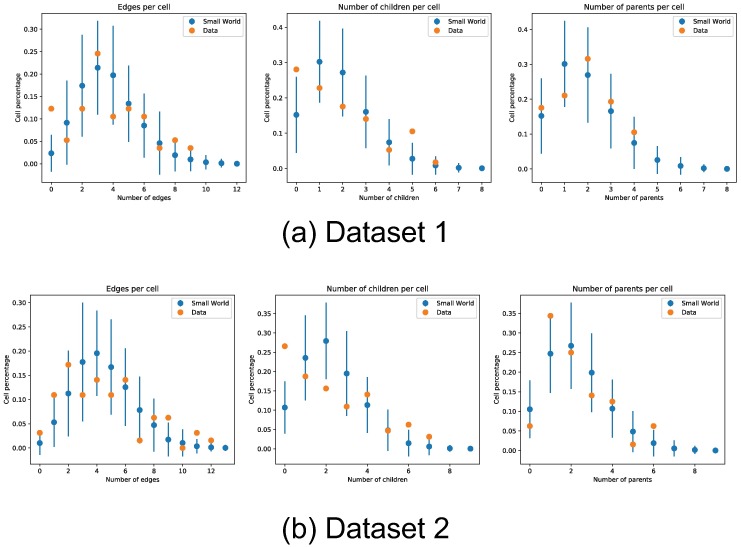
Fig 17. Edge density distribution of recovered inter neuron connectivity.
We compare the edge density distribution of the recovered inter neuron connectivity matrices in both datasets. Edge counts shown from left to right are all edges (number of neurons connected to node, either as parent or child), outbound edges (number of child nodes), and inbound nodes (number of parent nodes). The edge counts are compared against a base model of small-world network topology, error bars denote two standard deviations obtained from simulation of small-world networks with the same number of nodes and connectivity degree.

