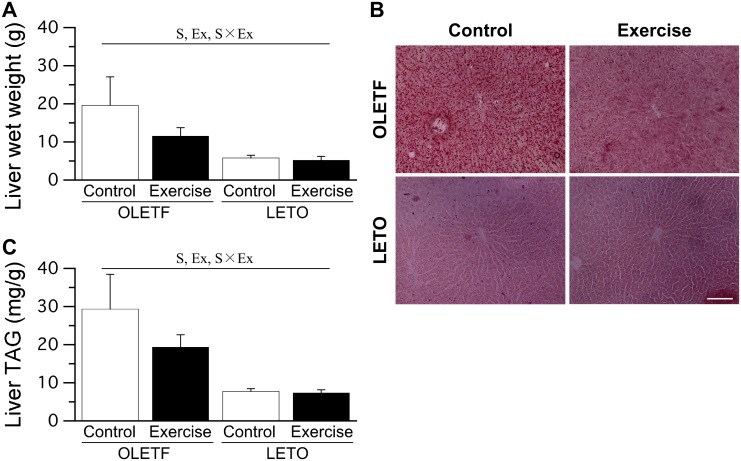
Fig 3. Liver wet weight (A), representative liver sections stained with Sudan red (B), and liver TAG levels (C).
Bar = 100 μm. Values represent means ± standard deviation. S, Ex, and S × Ex denote significant (p < 0.05) main effects of animal strain, exercise, and interaction between animal strain and exercise, respectively.

