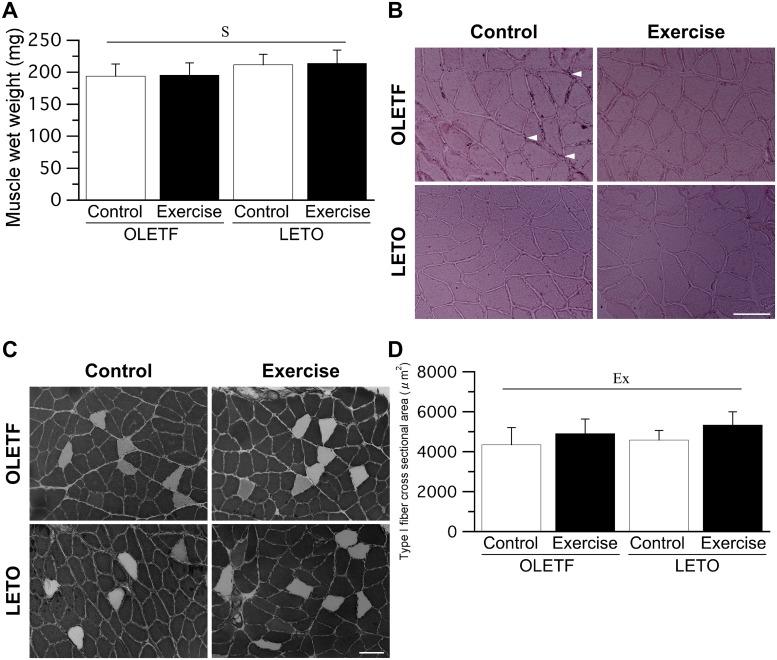
Fig 5. Muscle wet weight (A), representative sections of the soleus muscle stained with Sudan red (B) and staind for ATPase activity (C), muscle fiber type distribution (D), and muscle fiber cross-sectional area (E).
Arrow heads: ectopic lipid accumulation. Bar = 100 μm. Values represent means ± standard deviation., Ex, and S × Ex denote significant (p < 0.05) main effects of animal strain, exercise, and interaction between animal strain and exercise, respectively.

