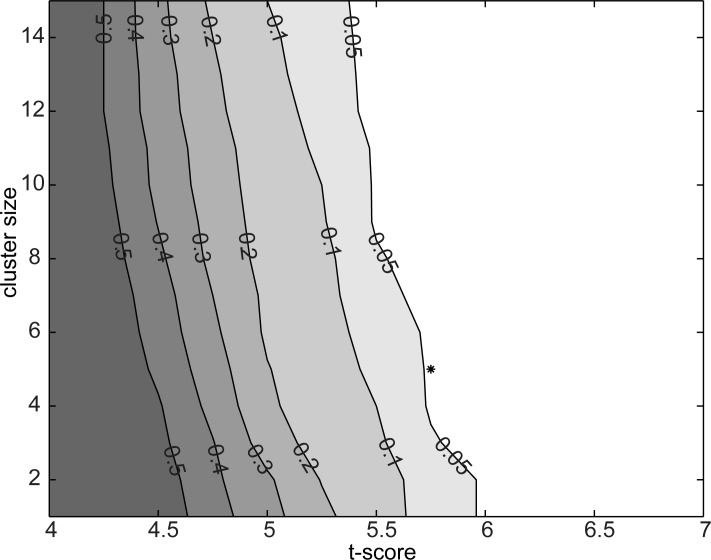
Fig 3. Estimation of appropriate statistical threshold.
Each contour line depicts the likelihood level that a random data set, in this experimental setup, would yield a chance finding. The selected parameter set (t-score = 5.75, cluster size = 5), with a probability of chance findings of 0.05 or less, is indicated by a star.

