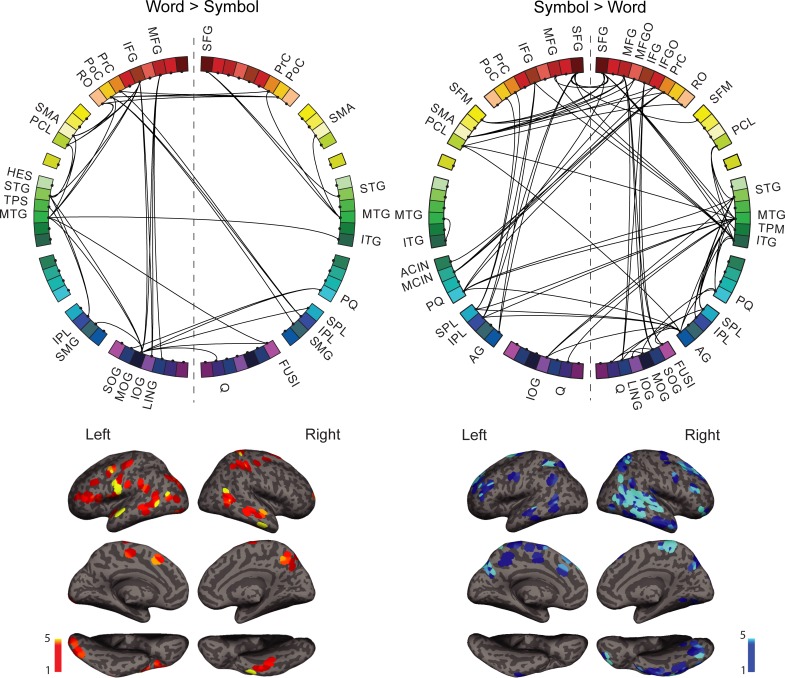
Fig 4. Spatial distribution of the stimulus-specific networks.
Above: The overall stimulus-specific network modulations across all frequency bands for Words>Symbols (left) and Symbols>Words (right) shown on the circular representation; for cortical parcellation and region indices, see Fig 2. Below: The corresponding anatomical locations of the connection start and end points on the cortex for Words (left panel) and Symbols (right panel). All frequencies are overlaid.

