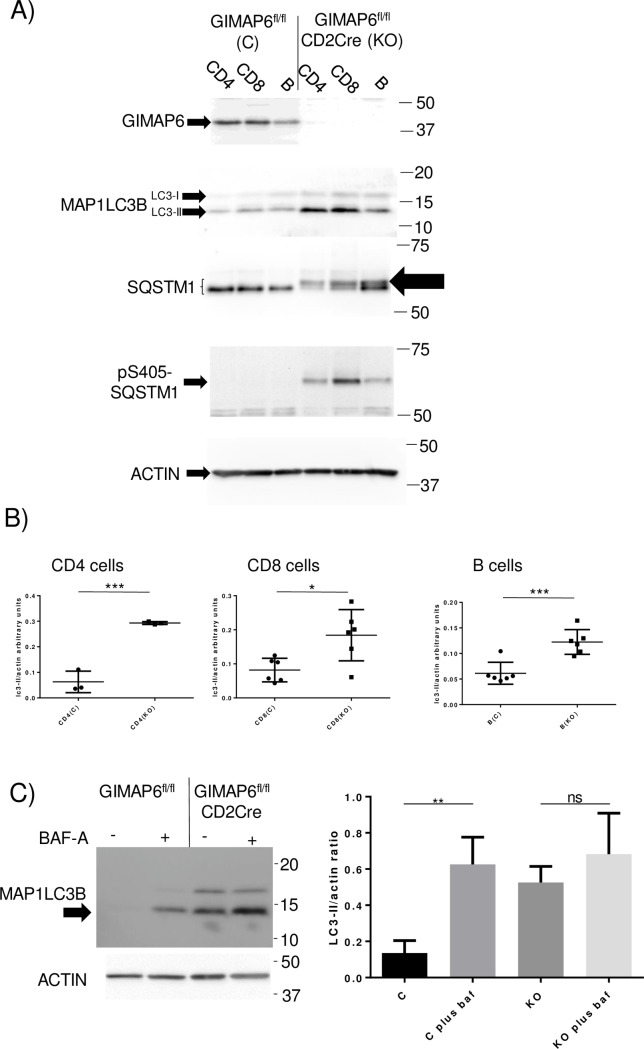
Fig 3. Expression levels of proteins in enriched lymphocyte fractions from GIMAP6fl/fl and GIMAP6fl/fl CD2Cre mice.
Panel A) CD4+, CD8+ and B cell enriched fractions were isolated from splenocytes from GIMAP6fl/fl and GIMAP6fl/flCD2Cre mice. Total cell lysates were prepared and analysed by SDS polyacrylamide gel electrophoresis and western blotting. The antibody sources can be found in the Materials and Methods section. The mobility of co-electrophoresed size markers is indicated. Immunoreactive protein species corresponding to phospho-S405 SQSTM1, a slower migrating SQSTM1 form, and the LC3-I and LC3-II variants of MAP1LC3B are indicated by arrows. All samples were analysed in at least two separate experiments. Panel B) Cellular populations were purified from single mice and analysed as in Panel A. The ratio of LC3-II to actin was determined from gel scans. For CD4+ cells n = 3; for CD8+ and B cells n = 6. P values are as follows: *p<0.05, ***p<0.001. Panel C) left-hand panel: freshly isolated splenic CD4+ cells from GIMAP6fl/fl and GIMAP6fl/flCD2Cre mice (four mice pooled per group) were cultured with or without 100nM bafilomycin A (BafA) for 5 hours before preparation of cell lysates and analysis by Western blotting. The LC3-II species is arrowed (representative of four separate experiments). Panel C) right-hand panel: LC3-II to actin ratios were measured for four separate experiments. Results are presented graphically. C—cells from GIMAP6fl/fl animals; KO—cells from GIMAP6fl/flCD2cre mice. P values are as follows: **p<0.01; ns p>0.05. n = 4.

