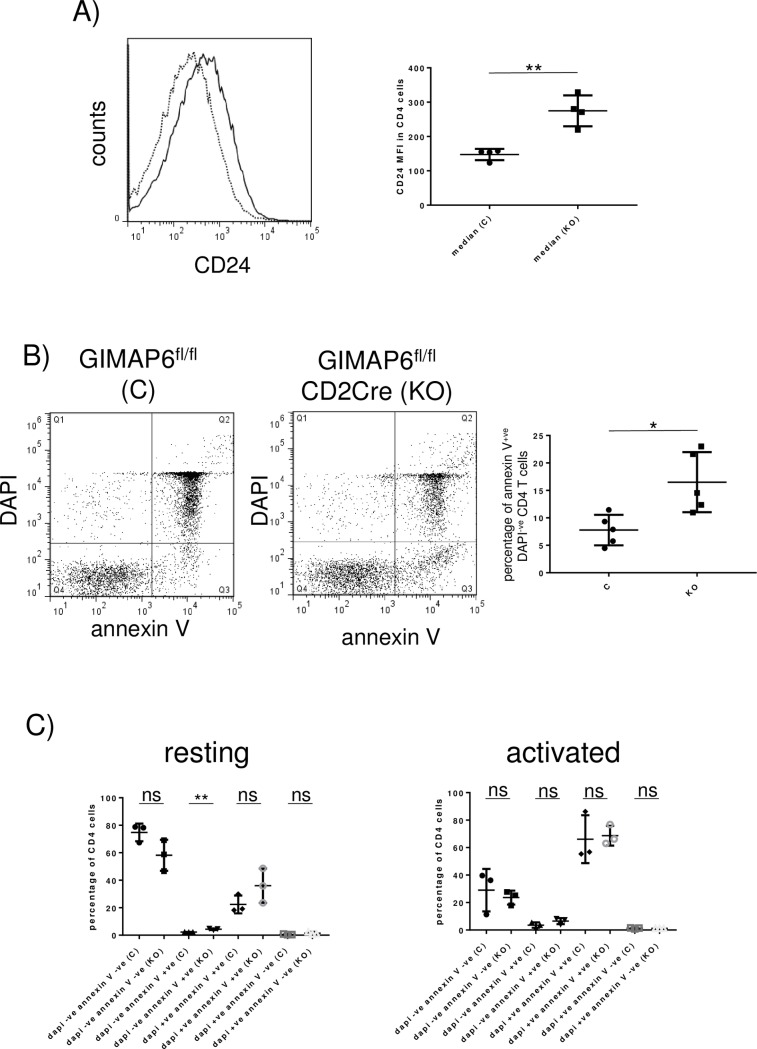
Fig 6. The reduced number of peripheral CD4+ T cells in GIMAP6fl/flCD2Cre mice reflects an increase in apoptosis.
A) Splenocytes isolated from GIMAP6fl/fl and GIMAP6fl/flCD2Cre animals were stained with fluorescent antibodies to CD4 and CD24. The left-hand panel shows the distribution of CD24 staining on CD4+ cells from single mice of the two genotypes (GIMAP6fl/fl–dotted line; GIMAP6fl/flCD2Cre–solid line). The right-hand panel shows the median fluorescence intensity of CD24 staining of CD4+ cells. n = 4; **P<0.01. B) Freshly isolated splenocytes were stained with an APC-conjugated antibody to CD4 and PE- conjugated annexin V. The cells were then washed and stained with DAPI before flow analysis. The two dot-plots show typical staining patterns for a control (C) and knockout (KO) animal. The quadrants are as follows: Q1 –annexin V- DAPI+; Q2 –annexin V+ DAPI+; Q3 –annexin V+ DAPI-; Q4 –annexin V- DAPI-. The right-hand panel summarises the percentage of annexin V+ cells as a percentage of total DAPI- CD4+ T cells for five animals in each group. ns P>0.05; ** P<0.01. C) CD4+ enriched naive splenocytes from GIMAP6fl/fl and GIMAP6fl/flCD2Cre mice were activated by maintenance on anti-CD3 antibody-coated plates in medium containing anti-CD28 and IL2 or were maintained in medium without activation as described in the Materials and Methods section. After 24 h cells were harvested and stained as in (B). The percentage of CD4+ T cells in each quadrant is indicated. n = 3 for each group; ns P>0.05; ** P<0.01.

