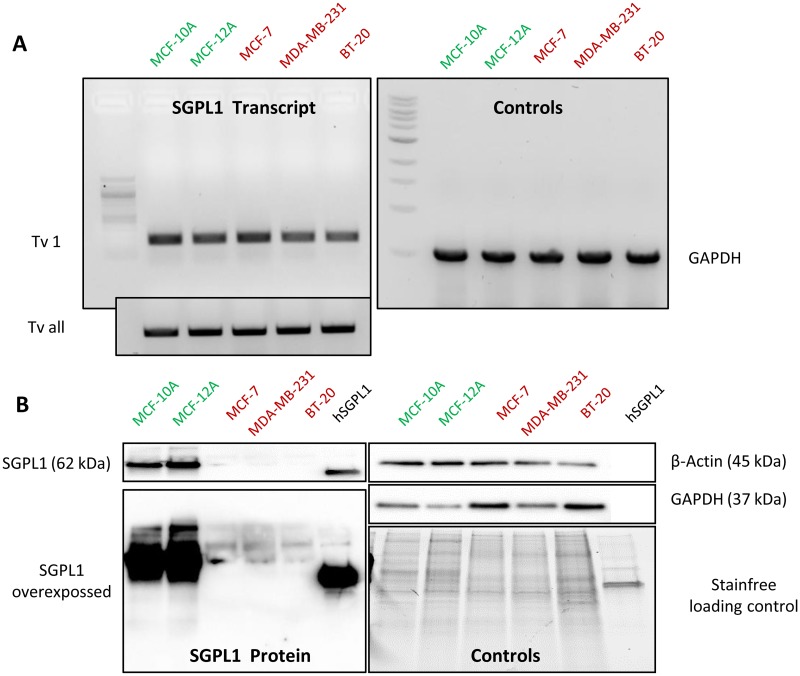
Fig 1. SGPL1 expression analysis.
A: RT-PCR with SGPL1 specific primers revealed no significantly altered SGPL1 expression on transcript level for main coding SGPL1 transcript variant 1 (Tv1) as well for the sum of all NCBI annotated SGPL1 transcript variants (Tv all) in comparison with the GAPDH control. B: SGPL1 protein content in the 5 epithelial breast cell lines (20 μg soluble protein) parallel to 10 ng recombinant SGPL1 protein was visualized by western blotting. Non-malignant breast epithelial cell lines MCF-10A and MCF-12A showed strongly elevated SGPL1 protein expression levels. Loading controls were verified by labeling ß-actin and GAPDH proteins as well as by stain-free technology. Uncropped immune blots are shown in S1 Fig.

