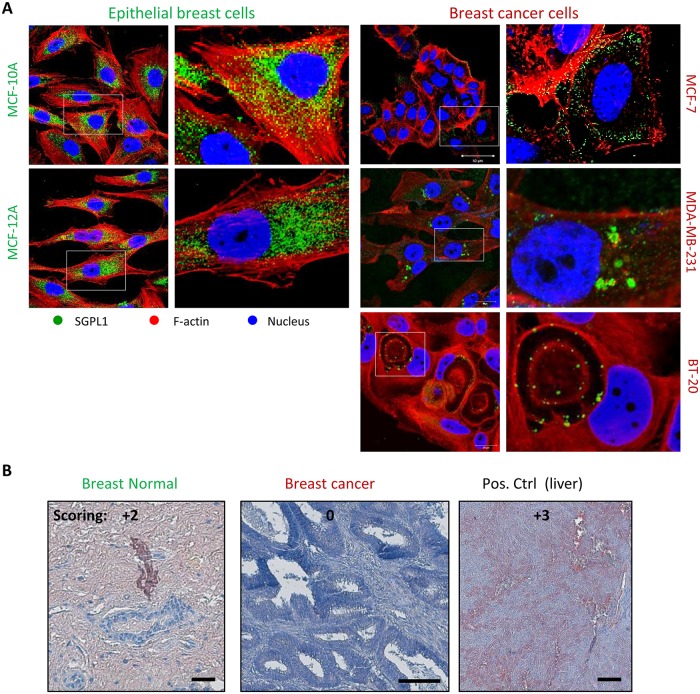
Fig 2.
A: Intracellular SGPL1 expression. A: SGPL1 immunofluorescence staining (green) of two non-malignant breast epithelial cell lines (MCF-10A, MCF-12A) in comparison with three established breast cancer cell lines (MCF-7, MDA-MB-231, BT-20) co-localized with ß-Actin (red) and nuclei (blue). B: Representative images of SGPL1 immunohistochemistry staining in normal and breast cancer tissue samples in comparison with positive control organs (liver). SGPL1: reddish brown; Nuclei: blue. Statistical evaluation of in vivo SGPL1 protein expression was performed by semi quantitative scoring (0 = no, 1+ = low, 2+ = medium, 3+ = strong expression). Notably, breast cancer tissue and all cancer cell lines displayed SGPL1 downregulation compared to normal breast tissue and non-tumorigenic cell lines.

