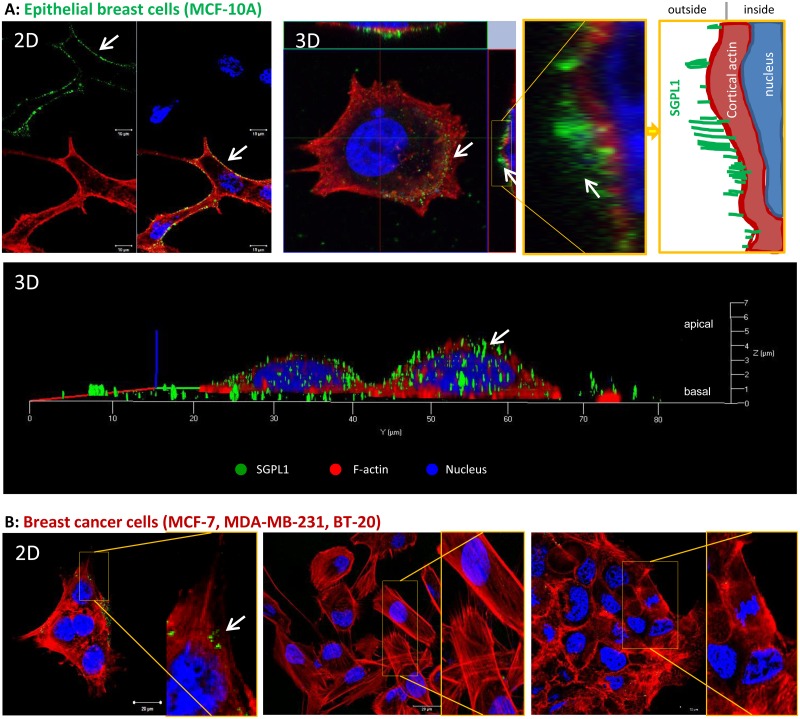
Fig 3. SGPL1 association with the plasma membrane.
The living non-tumorigenic breast cell line MCF-10A (A) in comparison with the three breast cancer cell lines MCF-7, MDA-MB-231, and BT-20 (B) were labeled with a C-terminal anti-SGPL1 antibody without fixation and permeabilization, so that only cell surface and plasma membrane proteins can be labeled. After secondary labeling with Alexa488 dye, cells were fixed and counterstained with Phalloidin and Hoechst. SGPL1: green, F-actin: red, Nuclei: blue. A: Images of MCF-10A cells in 2D (upper panel) and 3D (lower panel) to visualize SGPL1 protein signals in direct association with the cell surrounding plasma membrane. 3D images were taken with Zeiss confocal laser scanning microscope. White arrows point to the green SGPL1 protein sitting on the cortical actin cytoskeleton. Additionally, a schematic view of SGPL1 in association with cell periphery is given. B: 2D images of SGPL1 expression in the breast cancer cell lines. Note that only non-tumorigenic breast cells show clear SGPL1 expression in cell periphery.

