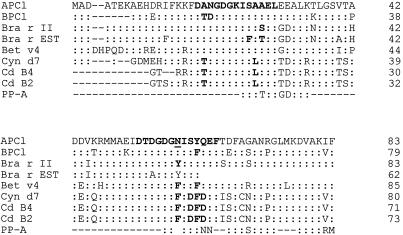
Figure 2.
Comparison of APC1 and BPC1 with other calcium-binding proteins. Alignment of the sequence was performed using Clustal (scoring matrix, PAM250; Thompson et al., 1994) and evaluated with PROTOMAT (Henikoff et al., 1995). Identical amino acids are indicated by colons, and alignment was optimized by insertion of dashes. Unknown amino acids are represented by spaces. The potential site of N-linked glycosylation is underlined. Positions of EF-hand motifs are shown in bold. The fit of the APC1 and BPC1 sequence to EF-hand consensus was evaluated with Blocks Searcher (Henikoff and Henikoff, 1994). Gene names are shown on the left and the number of amino acid residues per line and per protein are shown on the right. Bra r II, Accession no. D63154; Bra r EST, accession no. L47857; BET v 4, accession no. X87153 or Y12560; Cyn d 7, accession no. U35683; C.d. B4, accession no. A28050; and C.d. B2, accession no. A28046. The partial amino acid sequence determined from purified B. napus W1 PP-A was manually aligned with other sequences.

