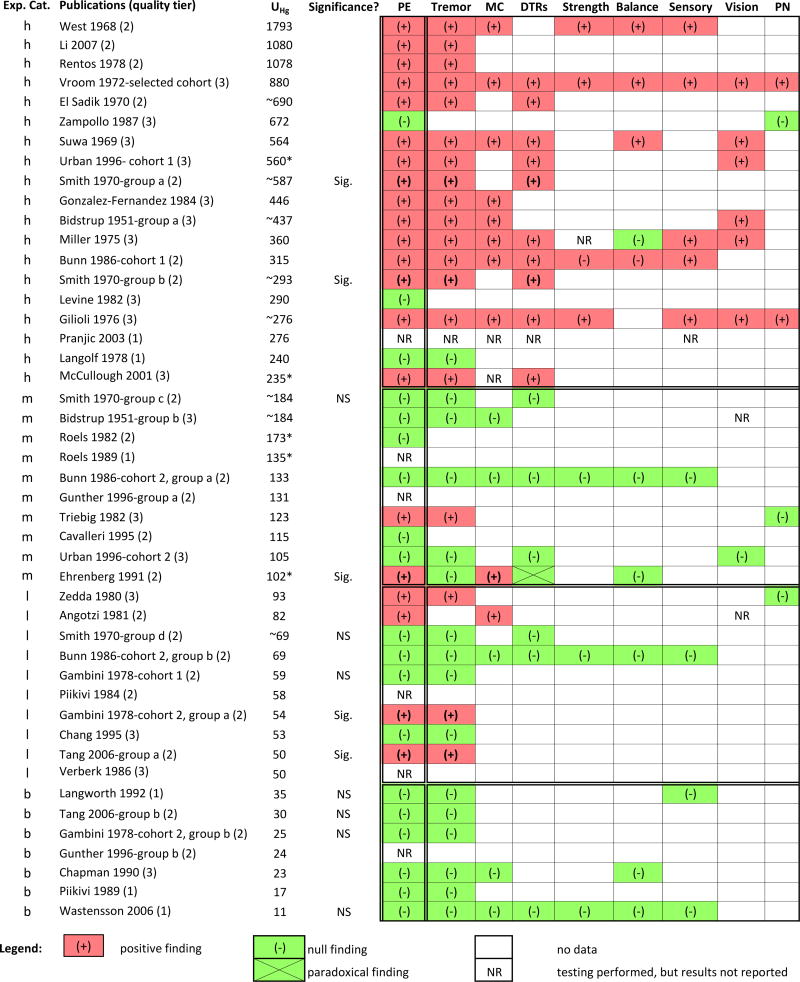
Figure 1.
Overview of occupational cohort studies that evaluated the association between mercury exposure and PE outcomes. Studies are listed top to bottom by decreasing group mean UHg values (µg/L) in exposed workers, and category of exposure is denoted (h=high, m=medium, l=low, b=<BEI).
Abbreviations: DTR = deep tendon reflexes; Exp. Cat. = exposure category; MC = motor coordination; NR = not reported; NS = not statistically significant; PE = physical examinations; PN=peripheral neuropathy; Sig. = statistically significant
* = UHg value was converted to µg/L from units originally reported in study, ~ = UHg estimated from average air Hg concentrations, as described in the Methods Section

