
Figure 2.
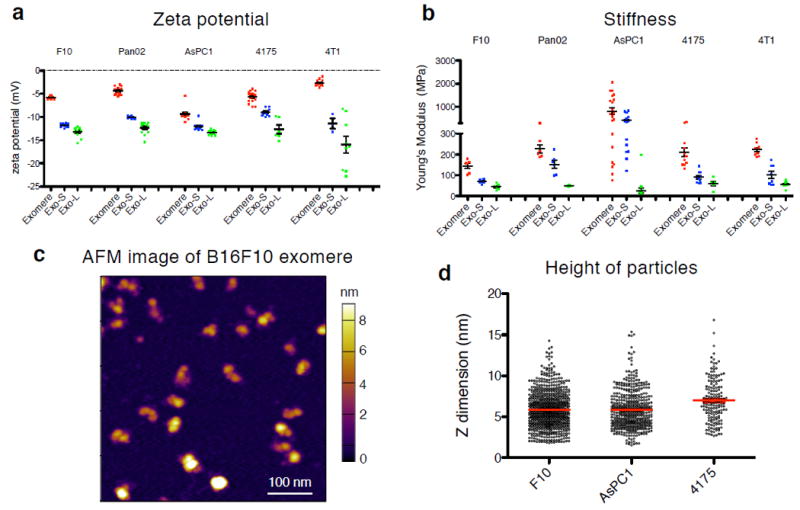
Characterization of physical and mechanical properties of exomeres and exosome subpopulations. Zeta potential (a) and stiffness (b) of exomeres and exosome subpopulations derived from various cancer cells were measured using Zetasizer and AFM indentation, respectively. Young’s modulus was used to express particle stiffness. At least 3 and 5 replicates for each group of particles was measured for zeta potential and stiffness, respectively. Data are presented as mean±SEM. For (a), in the order of exomere, Exo-S and Exo-L: B16-F10 (n=8, 10, and 12 independent measurements, respectively); Pan02 (n=13, 11, 13); AsPC-1 (n=12, 12, 12); 4175 (n=17, 9, 6); 4T1 (n=13, 3, 9); for (b), B16-F10 (n=6, 6, 6 particles measured); Pan02 (n=6, 6, 6); AsPC-1 (n=21, 19, 16); 4175 (n=11, 10, 5); 4T1 (n=9, 8, 9)). (c) Representative AFM image of exomeres derived from B16F10. This experiment was repeated with samples derived from 3 different cell lines with similar results. (d) AFM imaging analysis of the height (z-dimension) of exomeres derived from B16F10 (n=754 particles analyzed), AsPC1 (n=475) and MDA-MB-4175 (n=160). Mean±SEM is depicted. Statistical source data are provided in Supplementary Table 8.