
Figure 5.
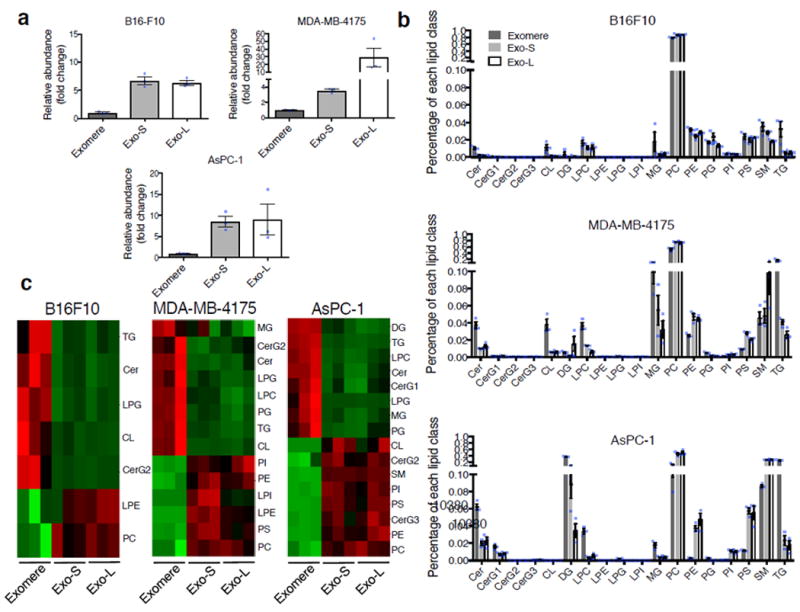
Characterization of lipid composition in exomeres and exosome subsets. (a) Comparison of total lipid content of each subset of nanoparticles derived from different cell lines. Total signal intensity of each sample after normalization to sample weight and internal standards was compared to that of exomeres from the same set of samples (expressed as fold change). Data are presented as mean±SEM (n=3 biologically independent samples). (b) Relative abundance of each lipid class present in each subset of nanoparticles from different cell lines. Data are presented as mean±SEM (n=3 biologically independent samples). For (a) and (b), statistical source data are provided in Supplementary Table 8. (c) Heat map illustration of lipid classes specifically associated with exomeres, Exo-S and Exo-L (ANOVA test, q<0.05). Statistical analysis was performed on a total of 9 samples for each cell line (3 different nanoparticle subtypes and 3 independent biological repeats for each nanoparticle sample). Abbreviation: Cer, ceramide; CerG1-3, glucosylceramides; CL, cardiolipin; DG, diglyceride; LPC, lysophosphatidylcholine; LPE, lysophosphatidylethanolamine; LPG, lysophosphatidylglycerol; LPI, lysophosphatidylinositol; MG, monoglyceride; PC, phosphatidylcholine; PE, phosphatidylethanolamine; PG, phosphatidylglycerol; PI, phosphatidylinositol; PS, phosphatidylserine; SM, sphingomyelin; TG, triglyceride.