
Figure 2.
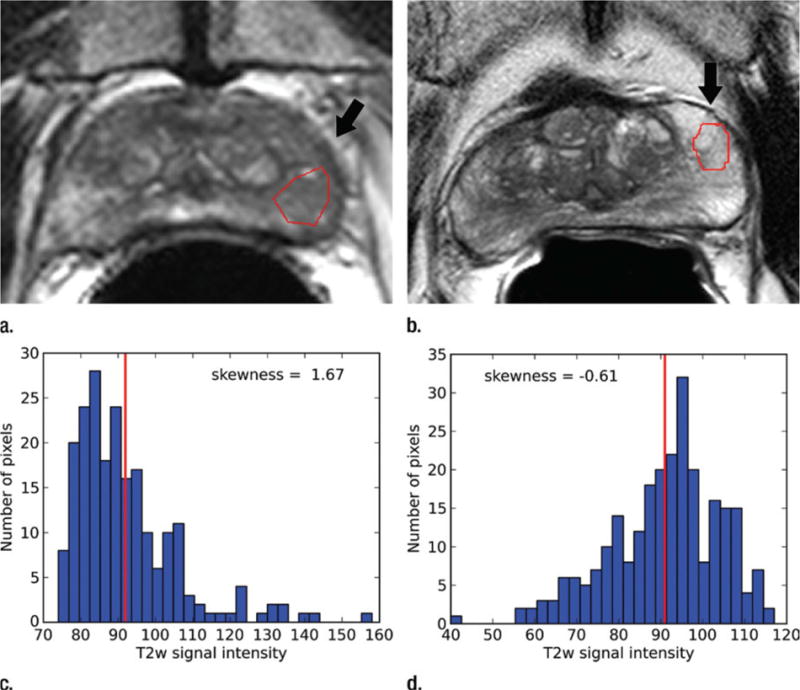
T2-weighted MR images show (a) a tumor (arrow) in a 66-year-old man with a GS of 7 (4+3) and a prostate-specific antigen level of 13.02 ng/mL and (b) an area of PZ normal tissue (arrow) in a 64-year-old man with prostate cancer elsewhere. Red outlines indicate ROIs. (c, d) Corresponding histograms show T2-weighted signal intensities within the ROIs and the corresponding skewness image feature values. The tumor ROI has more dark pixels than bright pixels, whereas the normal tissue ROI has more bright pixels than dark pixels. Red lines in c and d identify the average, T2-weighted signal intensity within each ROI.