
Fig. 1. Sampling design and analyses of surveys across the New Caledonian archipelago, southwestern Pacific.
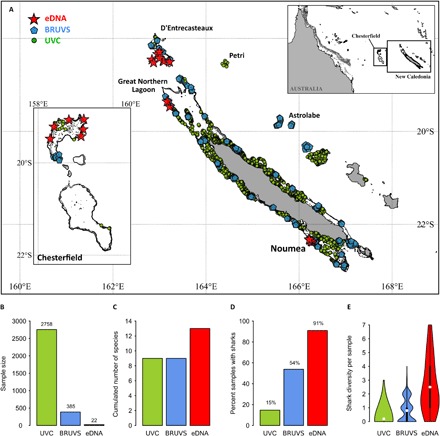
(A) Sampling design in the New Caledonian archipelago (red stars, eDNA; blue pentagons, BRUVS; green dots, UVC). (B) Sample size (UVC, n = 2758; BRUVS, n = 385; eDNA, n = 22). (C) Cumulated number of shark species detected. (D) Frequency of samples with sharks detected. (E) Violin plot showing detected shark species richness, significantly different between techniques (P < 0.001, Kruskal-Wallis test), with eDNA detecting more shark species (2.5 ± 1.9) compared to BRUVS (0.8 ± 0.8) and UVC (0.2 ± 0.5) (P < 0.001, Dunn’s tests). White dots are mean values; thick black bars correspond to interquartile ranges; thin black lines are 95% confidence intervals.