
Fig. 2. Detection of shark species with different sampling methods.
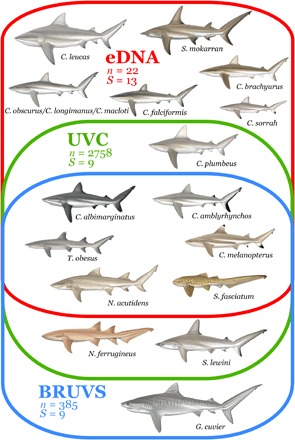
Venn diagram showing the species detected by eDNA (n = 22 samples, S = 13 species), UVC (n = 2758 samples, S = 9 species), and BRUVS (n = 385 samples, S = 9 species). Scientific drawings courtesy of M. Dando.