
Fig. 1. Identification of mycobacterial subpopulations that grow in the presence of drug.
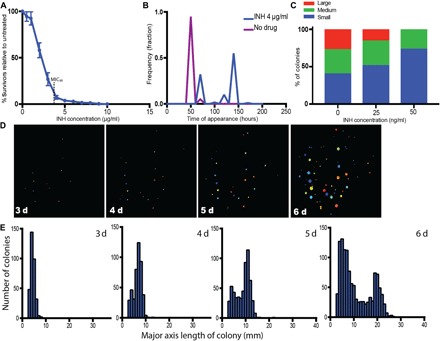
(A, B, D, and E) M. smegmatis. (C) M. tuberculosis. (A) Colonies formed on INH plates with indicated concentrations as a percentage of colonies formed on plates without drug. (B) Time of initial detection of colonies, as determined by CellProfiler, in the presence and absence of INH (4 μg/ml). (C) Distribution of M. tuberculosis colony sizes after 22 days of growth on INH. (D) Example series of one plate tracked over time with CellProfiler (INH, 4 μg/ml). Plates were run through custom program, and colored circles indicate the actual size of the detected colonies. (E) Histogram of major axis length of colonies for all colonies plated over time (INH, 4 μg/ml).