
Fig. 3. Variants have distinct transcriptional signatures.
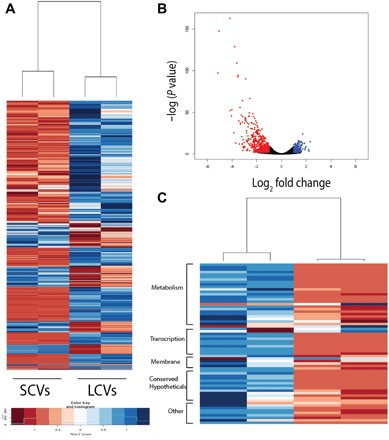
Pools of LCVs and SCVs were assayed in duplicate. (A) Hierarchical clustering analysis of genes differentially expressed more than threefold. (B) Volcano plot analysis of RNA-seq data comparing gene expression profiles of SCVs and LCVs. Dots indicated in red and blue are genes that are down-regulated and up-regulated, respectively, in the SCVs more than twofold with a P value of <0.01. (C) Gene categories of genes differentially expressed >10-fold in LCVs versus SCVs.