
Fig. 4. Loss of HupB results in significant reduction of colony formation in the presence of INH and alters gene expression.
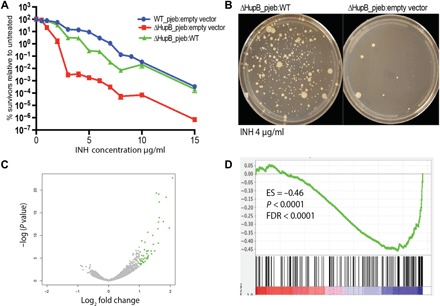
(A) Percent survivors were calculated from the number of colonies counted on the plates with drug as compared to the number of colonies on the plates without drug. (B) Representative images of ΔHupB_pjeb:WT and ΔHupB_pjeb:empty vector plated on INH (4 μg/ml). (C) RNA-seq analysis comparing gene expression patterns in ΔHupB_pjeb:WT and ΔHupB_pjeb:empty. Dots indicated in green are up-regulated in the ΔHupB_pjeb:empty strain. Strains were collected at late stationary phase. (D) GSEA of genes differentially expressed in ΔHupB_pjeb:empty strain versus ΔHupB_pjeb:WT as compared to the genes identified as down-regulated more than fourfold with a P value of <0.01 using DESeq analysis in comparison to SCV versus LCV. ES, enrichment score.