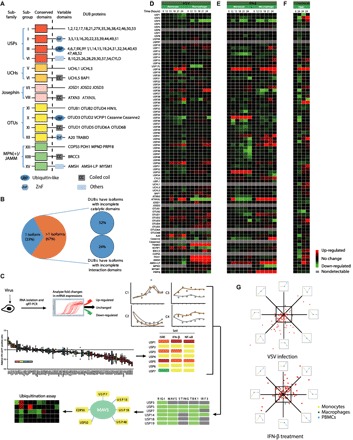
Fig. 1. A large number of DUBs are regulated by virus-induced type I IFN signaling at the transcriptional level.

(A) Domain organization of DUB subfamilies [USPs, UCHs, Josephins, OTUs, and MPN(+)/JAMMs]. (B) DUB splice variants were mapped according to the UniProt database. Isoforms with incomplete catalytic domains or interaction domains were analyzed. (C) Schematic diagram illustrating the screening approach. (D) qRT-PCR analysis of the mRNA level of individual DUBs in THP-1 monocytes (left, lanes 1 to 6) or THP-1–derived macrophages (right, lanes 7 to 12) with VSV (MOI, 0.01) infection for the indicated time points. Data were normalized to the mRNA levels in untreated cells (0 hours) and were presented in a heat map. (E) qRT-PCR analysis of mRNA levels of individual DUBs in THP-1 monocytes (left, lanes 1 to 6) or THP-1–derived macrophages (right, lanes 7 to 12) treated with IFN-β (1000 U/ml) for the indicated time points. Data were normalized to the basal mRNA levels and were presented in a heat map. (F) qRT-PCR analysis of mRNA levels of the indicated DUBs in VSV-infected (MOI, 0.01) (lane 2), HSV-1–infected (MOI, 0.1) (lane 3), or IFN-β–treated (1000 U/ml) (lane 4) PBMCs. Data were normalized to the basal mRNA levels. (G) Distribution of different expression tendencies of DUBs between different cell types upon VSV infection or IFN-β stimulation. Each point represents the difference of a certain DUB expression among different cell types, plotted by the natural logarithm of expression difference ratio between THP-1 monocytes and THP-1–derived macrophages on the horizontal axis and the ratio between PBMCs and THP-1–derived macrophages on the vertical axis. Data are representative of three independent experiments (D to F).
