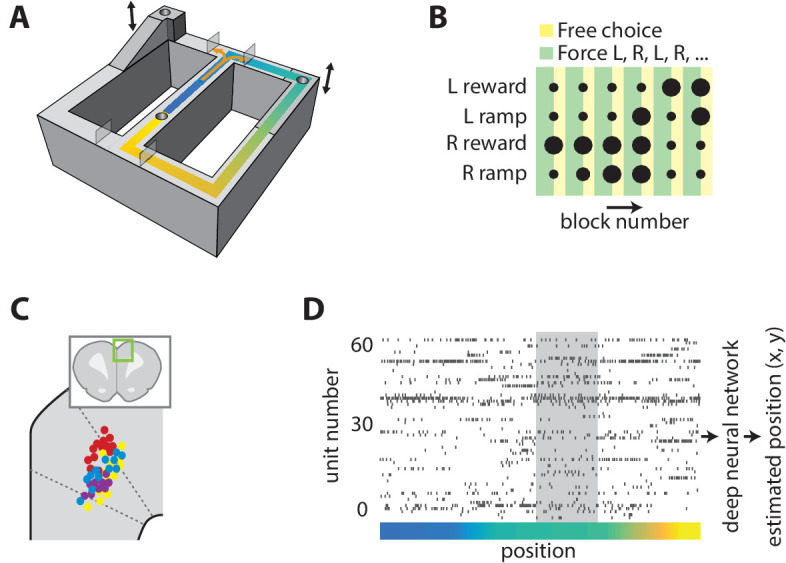
Figure 1. Task and neural recording.
(A) Schematic illustration of the figure-8 track, showing the locations of the feeders (cylindrical depressions), height-adjustable platforms (indicated by arrows), and movable gates (translucent rectangles). (B) Graphical representation of the choice reward-effort utilities (dot size) and choice option (color) structure of one task session. The effort-reward utility of each choice was constant during each block of 16 laps. (C) Illustration of estimated recording locations in the dorsal medial prefrontal cortex (inset), showing that most fell in the ACC. (D) Representative example of simultaneously recorded ACC ensemble activity during one lap of the task. The color indicates the position on the track as coded in panel A, and the grey shaded region is corresponds to the target feeder location.


